Montana Nativity & Citizenship Status (2024)
Place of birth and citizenship status analysis for Montana
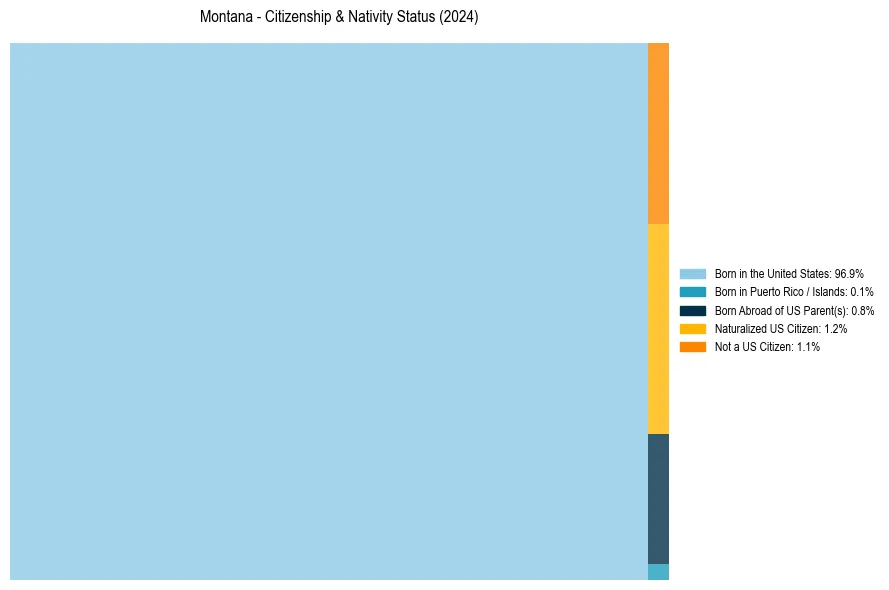
Montana Nativity & Citizenship Indicators (2024)
Native Born
97.7%
Foreign Born
2.3%
Naturalized
1.2%
US Citizens
98.9%
Montana Nativity & Citizenship Distribution
Montana Historical Nativity Trends (2010–2024)
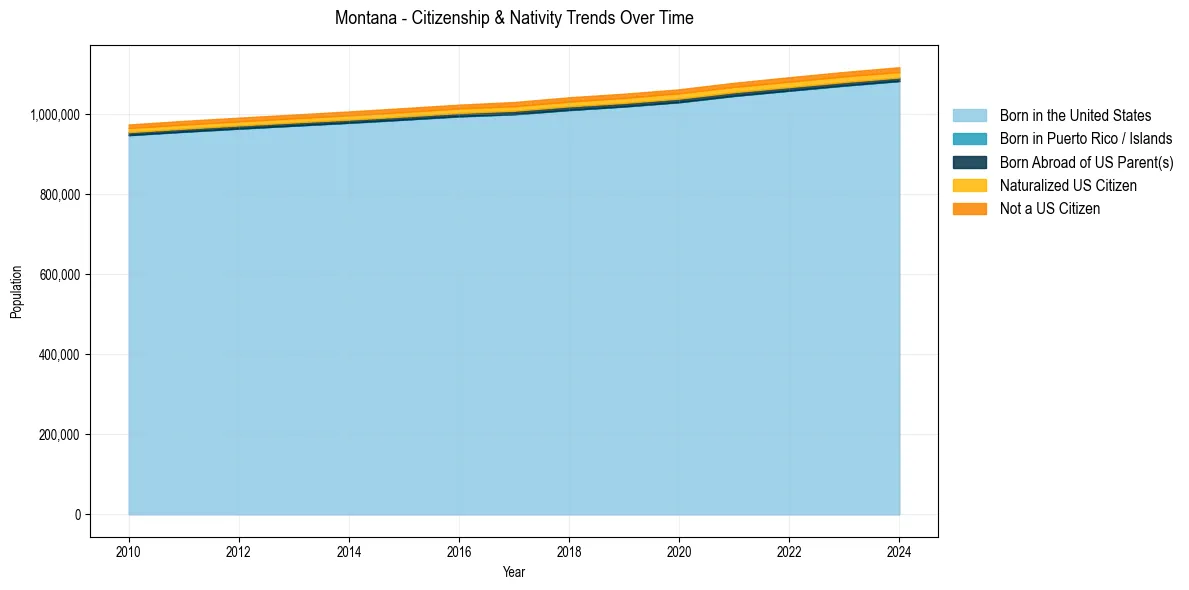
Montana Population & Nativity History
| Year | Total Pop | Foreign Born | Native Born |
|---|---|---|---|
| 2024 | 1,116,875 | 2.3% | 97.7% |
| 2023 | 1,105,072 | 2.3% | 97.7% |
| 2022 | 1,091,840 | 2.3% | 97.7% |
| 2021 | 1,077,978 | 2.2% | 97.8% |
| 2020 | 1,061,705 | 2.2% | 97.8% |
| 2019 | 1,050,649 | 2.2% | 97.8% |
| 2018 | 1,041,732 | 2.2% | 97.8% |
| 2017 | 1,029,862 | 2.1% | 97.9% |
| 2016 | 1,023,391 | 2.0% | 98.0% |
| 2015 | 1,014,699 | 2.1% | 97.9% |
| 2014 | 1,006,370 | 2.0% | 98.0% |
| 2013 | 998,554 | 2.0% | 98.0% |
| 2012 | 990,785 | 2.0% | 98.0% |
| 2011 | 982,854 | 2.0% | 98.0% |
| 2010 | 973,739 | 2.0% | 98.0% |
Nativity & Citizenship FAQs for Montana
Approximately 2.3% of residents in Montana were born outside the United States.
The vast majority of residents, roughly 98.9%, are U.S. citizens (including both native-born and naturalized citizens).