Yellowstone County, Montana Nativity & Citizenship Status (2024)
Place of birth and citizenship status analysis for Yellowstone County, Montana
Yellowstone County, Montana Nativity & Citizenship Indicators (2024)
Native Born
98.1%
Foreign Born
1.9%
Naturalized
0.9%
US Citizens
99.0%
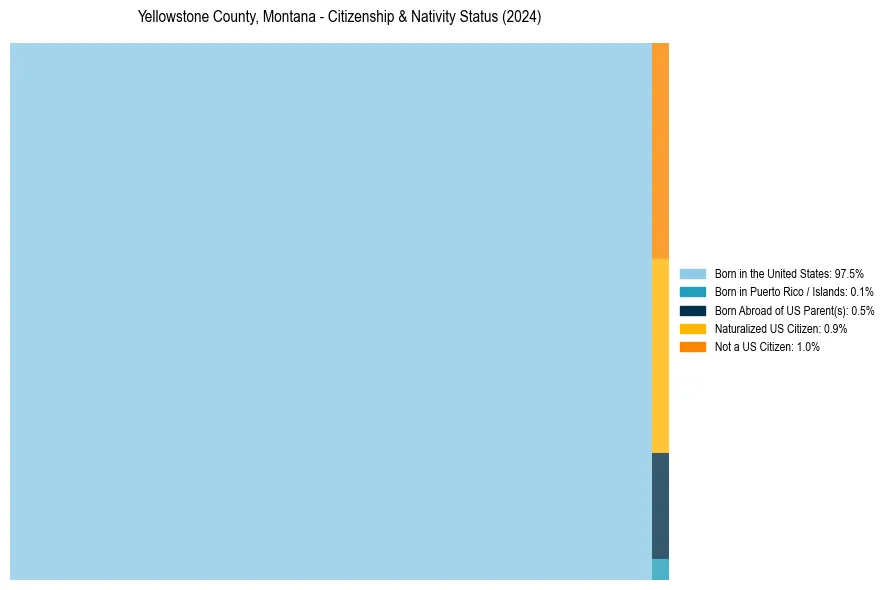
Yellowstone County, Montana Nativity & Citizenship Distribution
Yellowstone County, Montana Historical Nativity Trends (2010–2024)
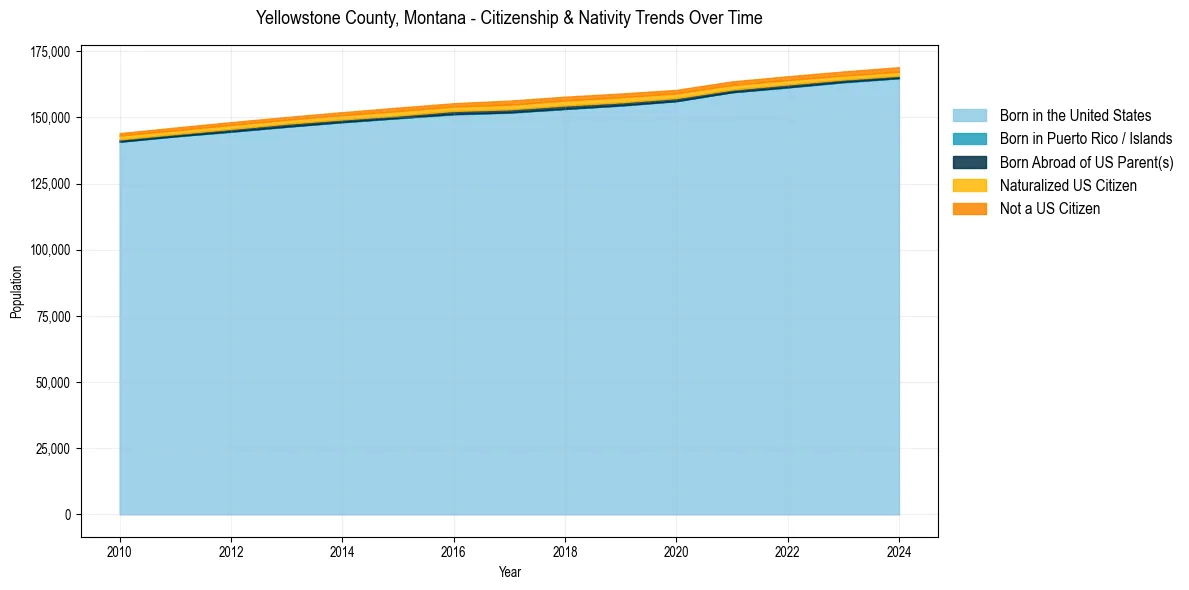
Yellowstone County, Montana Population & Nativity History
| Year | Total Pop | Foreign Born | Native Born |
|---|---|---|---|
| 2024 | 168,957 | 1.9% | 98.1% |
| 2023 | 167,340 | 1.8% | 98.2% |
| 2022 | 165,524 | 1.9% | 98.1% |
| 2021 | 163,593 | 1.9% | 98.1% |
| 2020 | 160,390 | 1.9% | 98.1% |
| 2019 | 159,008 | 2.1% | 97.9% |
| 2018 | 157,816 | 2.1% | 97.9% |
| 2017 | 156,332 | 2.1% | 97.9% |
| 2016 | 155,344 | 1.9% | 98.1% |
| 2015 | 153,692 | 2.0% | 98.0% |
| 2014 | 151,965 | 1.8% | 98.2% |
| 2013 | 150,156 | 1.7% | 98.3% |
| 2012 | 148,191 | 1.7% | 98.3% |
| 2011 | 146,151 | 1.7% | 98.3% |
| 2010 | 144,050 | 1.7% | 98.3% |
Nativity & Citizenship FAQs for Yellowstone County, Montana
Approximately 1.9% of residents in Yellowstone County, Montana were born outside the United States.
The vast majority of residents, roughly 99.0%, are U.S. citizens (including both native-born and naturalized citizens).