United States Nativity & Citizenship Status (2024)
Place of birth and citizenship status analysis for the United States
United States Nativity & Citizenship Indicators (2024)
Native Born
85.9%
Foreign Born
14.1%
Naturalized
7.4%
US Citizens
93.2%
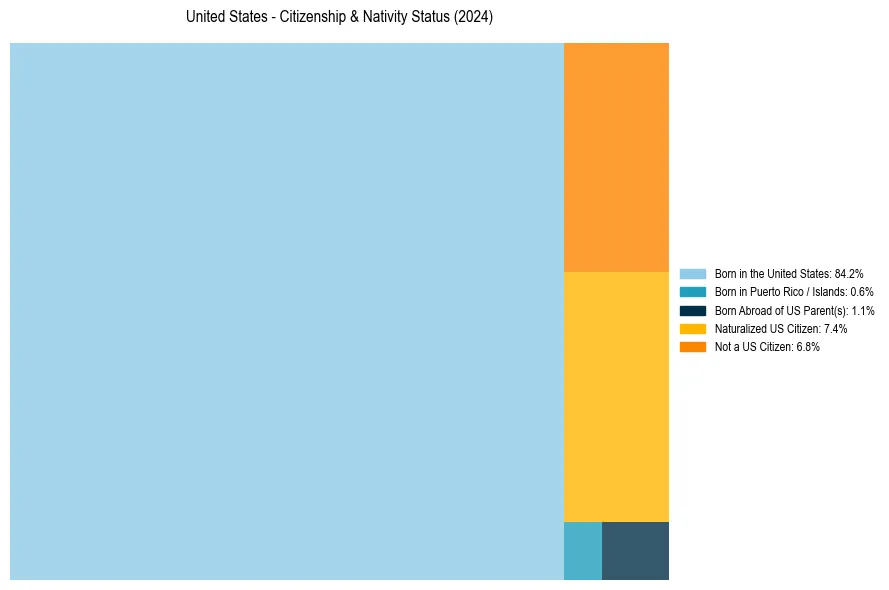
United States Nativity & Citizenship Distribution
United States Historical Nativity Trends (2010–2024)
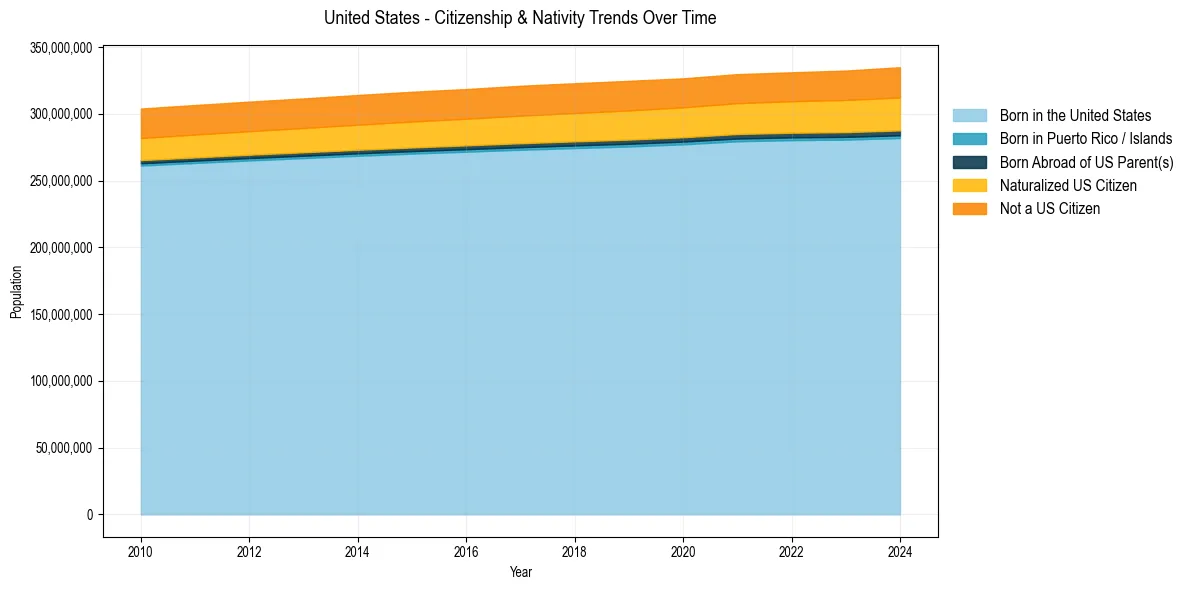
United States Population & Nativity History
| Year | Total Pop | Foreign Born | Native Born |
|---|---|---|---|
| 2024 | 334,922,499 | 14.1% | 85.9% |
| 2023 | 332,387,540 | 13.9% | 86.1% |
| 2022 | 331,097,593 | 13.7% | 86.3% |
| 2021 | 329,725,481 | 13.6% | 86.4% |
| 2020 | 326,569,308 | 13.5% | 86.5% |
| 2019 | 324,697,795 | 13.6% | 86.4% |
| 2018 | 322,903,030 | 13.5% | 86.5% |
| 2017 | 321,004,407 | 13.4% | 86.6% |
| 2016 | 318,558,162 | 13.2% | 86.8% |
| 2015 | 316,515,021 | 13.2% | 86.8% |
| 2014 | 314,107,084 | 13.1% | 86.9% |
| 2013 | 311,536,594 | 12.9% | 87.1% |
| 2012 | 309,138,711 | 12.9% | 87.1% |
| 2011 | 306,603,772 | 12.8% | 87.2% |
| 2010 | 303,965,272 | 12.7% | 87.3% |
Nativity & Citizenship FAQs for United States
Approximately 14.1% of residents in the United States were born outside the United States.
The vast majority of residents, roughly 93.2%, are U.S. citizens (including both native-born and naturalized citizens).