Nevada Age & Gender Distribution (2024)
Population distribution by age and gender for Nevada
Nevada Age & Gender Statistics (2024)
Total Population
3,184,612
Median Age
39.1
Male Median
38.6
Female Median
39.7
Nevada Population Growth
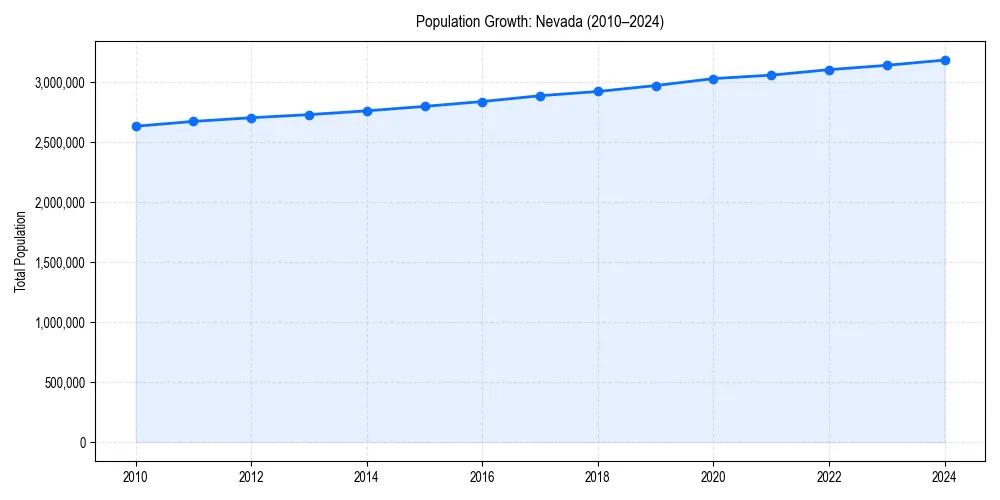
Nevada Demographic Trend
Since 2010, the population of has changed by +20.9%%.
+20.9%% Growth
Nevada Age & Gender Pyramid
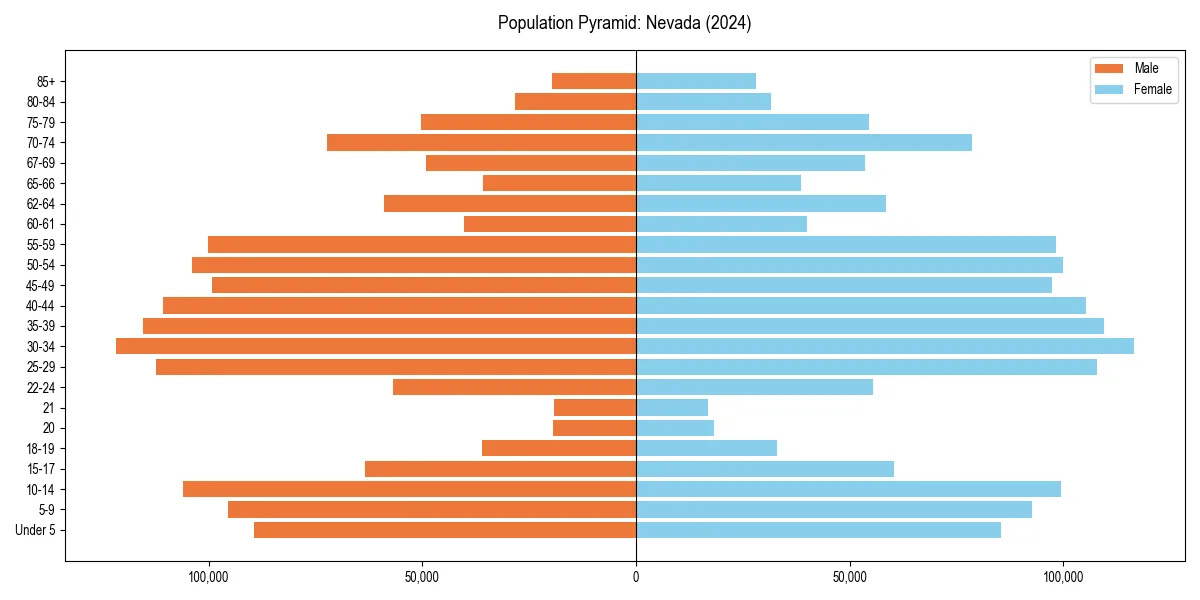
Figure 2: Population distribution by age and gender for 2024.
Nevada Historical Population Data
| Year | Median Age | Population |
|---|---|---|
| 2024 | 39.1 | 3,184,612 |
| 2023 | 38.9 | 3,141,000 |
| 2022 | 38.5 | 3,104,817 |
| 2021 | 38.3 | 3,059,238 |
| 2020 | 38.2 | 3,030,281 |
| 2019 | 38.0 | 2,972,382 |
| 2018 | 37.9 | 2,922,849 |
| 2017 | 37.7 | 2,887,725 |
| 2016 | 37.5 | 2,839,172 |
| 2015 | 37.2 | 2,798,636 |
| 2014 | 36.9 | 2,761,584 |
| 2013 | 36.6 | 2,730,066 |
| 2012 | 36.3 | 2,704,204 |
| 2011 | 36.1 | 2,673,396 |
| 2010 | 35.9 | 2,633,331 |
Nevada Age Group Breakdown (2024)
| Age Cohort | Percentage |
|---|---|
| Under 5 | 5.5% |
| 5–17 | 16.3% |
| 18–24 | 8.0% |
| 25–34 | 14.4% |
| 35–54 | 26.4% |
| 55–64 | 12.4% |
| 65+ | 17.0% |
Dependency Ratios for Nevada
- Total Dependency Ratio:
- 63.2
- Youth Dependency:
- 35.5
- Old-Age Dependency:
- 27.7
The dependency ratio measures dependents (ages 0-17 and 65+) per 100 working-age individuals (ages 18-64).
Age & Gender FAQs for Nevada
The median age in Nevada is 39.1 years.
According to latest Census data, the total population of Nevada is 3,184,612.
In Nevada, seniors (ages 65+) make up 17.0% of the population, while children under 18 represent 16.3%.
Based on historical data since 2010, the population in Nevada is aging.