Grafton County, New Hampshire Nativity & Citizenship Status (2024)
Place of birth and citizenship status analysis for Grafton County, New Hampshire
Grafton County, New Hampshire Nativity & Citizenship Indicators (2024)
Native Born
94.4%
Foreign Born
5.6%
Naturalized
3.1%
US Citizens
97.5%
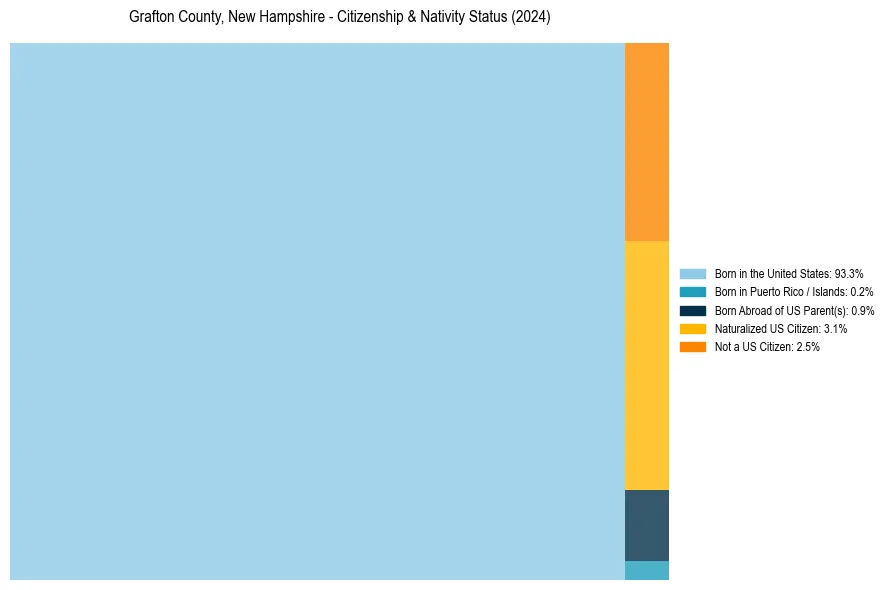
Grafton County, New Hampshire Nativity & Citizenship Distribution
Grafton County, New Hampshire Historical Nativity Trends (2010–2024)
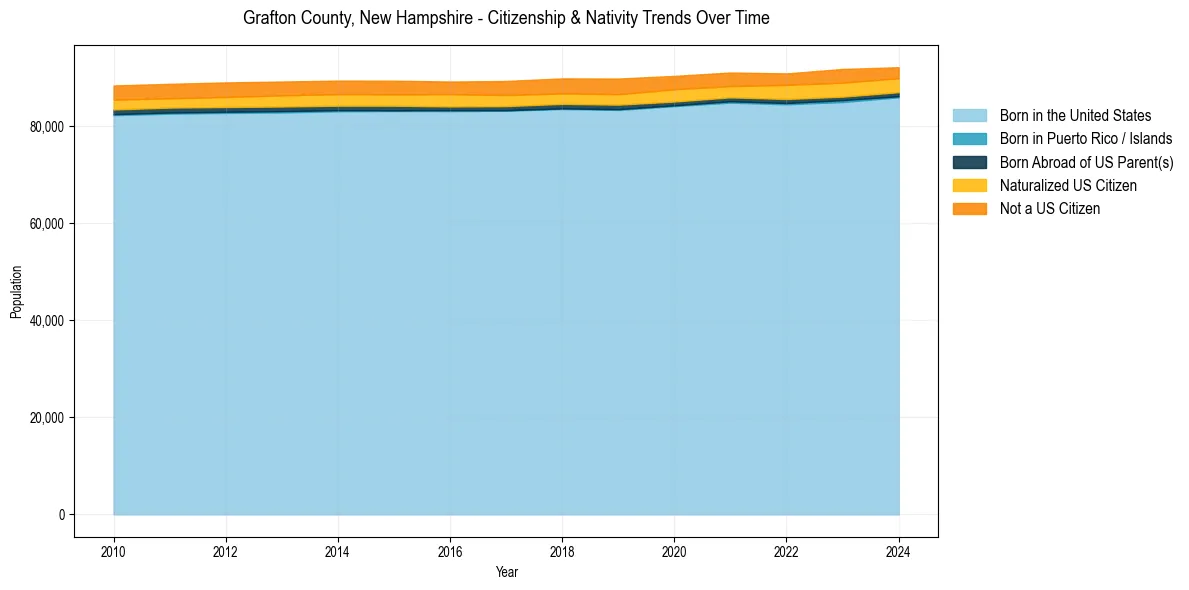
Grafton County, New Hampshire Population & Nativity History
| Year | Total Pop | Foreign Born | Native Born |
|---|---|---|---|
| 2024 | 92,120 | 5.6% | 94.4% |
| 2023 | 91,759 | 6.2% | 93.8% |
| 2022 | 90,836 | 5.8% | 94.2% |
| 2021 | 91,025 | 5.6% | 94.4% |
| 2020 | 90,331 | 5.9% | 94.1% |
| 2019 | 89,777 | 6.0% | 94.0% |
| 2018 | 89,811 | 5.8% | 94.2% |
| 2017 | 89,280 | 5.8% | 94.2% |
| 2016 | 89,164 | 5.8% | 94.2% |
| 2015 | 89,341 | 5.8% | 94.2% |
| 2014 | 89,360 | 5.8% | 94.2% |
| 2013 | 89,166 | 5.8% | 94.2% |
| 2012 | 88,985 | 5.7% | 94.3% |
| 2011 | 88,696 | 5.5% | 94.5% |
| 2010 | 88,356 | 5.6% | 94.4% |
Nativity & Citizenship FAQs for Grafton County, New Hampshire
Approximately 5.6% of residents in Grafton County, New Hampshire were born outside the United States.
The vast majority of residents, roughly 97.5%, are U.S. citizens (including both native-born and naturalized citizens).