Bernalillo County, New Mexico Nativity & Citizenship Status (2024)
Place of birth and citizenship status analysis for Bernalillo County, New Mexico
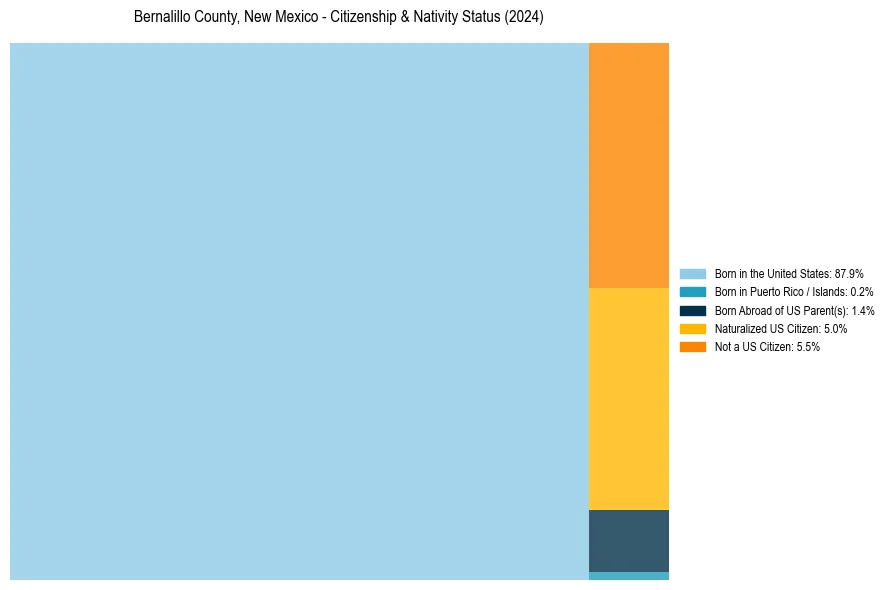
Bernalillo County, New Mexico Nativity & Citizenship Indicators (2024)
Native Born
89.5%
Foreign Born
10.5%
Naturalized
5.0%
US Citizens
94.5%
Bernalillo County, New Mexico Nativity & Citizenship Distribution
Bernalillo County, New Mexico Historical Nativity Trends (2010–2024)
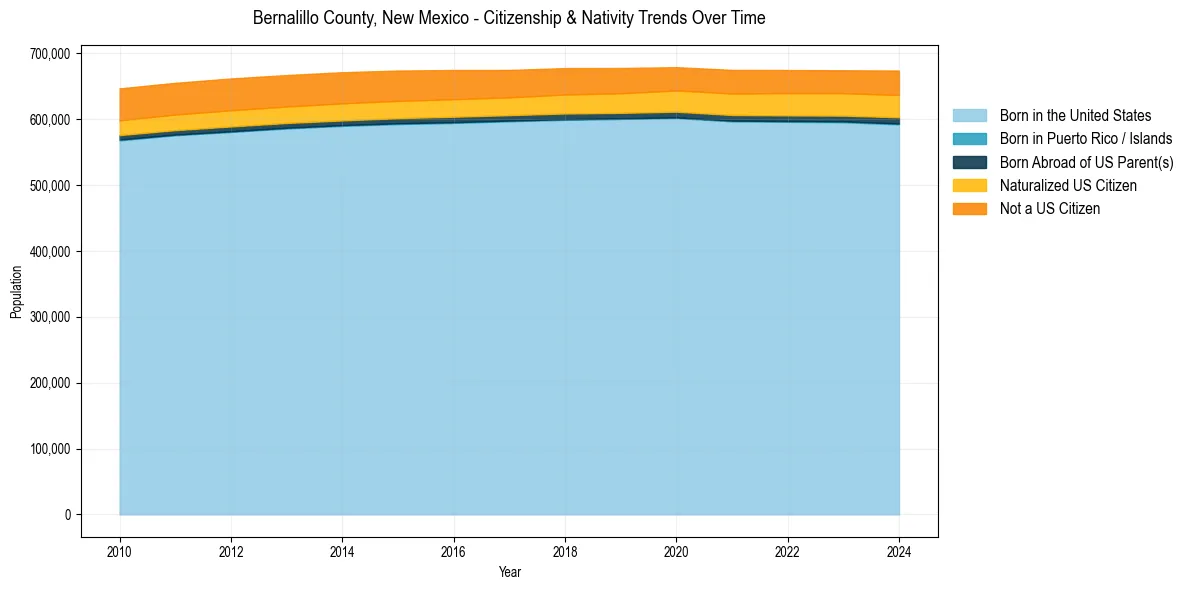
Bernalillo County, New Mexico Population & Nativity History
| Year | Total Pop | Foreign Born | Native Born |
|---|---|---|---|
| 2024 | 673,930 | 10.5% | 89.5% |
| 2023 | 674,357 | 10.2% | 89.8% |
| 2022 | 674,692 | 10.2% | 89.8% |
| 2021 | 674,919 | 10.2% | 89.8% |
| 2020 | 679,037 | 10.0% | 90.0% |
| 2019 | 677,858 | 10.1% | 89.9% |
| 2018 | 677,692 | 10.2% | 89.8% |
| 2017 | 674,855 | 10.2% | 89.8% |
| 2016 | 674,777 | 10.5% | 89.5% |
| 2015 | 673,943 | 10.7% | 89.3% |
| 2014 | 671,429 | 10.9% | 89.1% |
| 2013 | 667,092 | 10.9% | 89.1% |
| 2012 | 661,924 | 11.0% | 89.0% |
| 2011 | 655,306 | 11.0% | 89.0% |
| 2010 | 646,881 | 11.0% | 89.0% |
Nativity & Citizenship FAQs for Bernalillo County, New Mexico
Approximately 10.5% of residents in Bernalillo County, New Mexico were born outside the United States.
The vast majority of residents, roughly 94.5%, are U.S. citizens (including both native-born and naturalized citizens).