Curry County, New Mexico Nativity & Citizenship Status (2024)
Place of birth and citizenship status analysis for Curry County, New Mexico
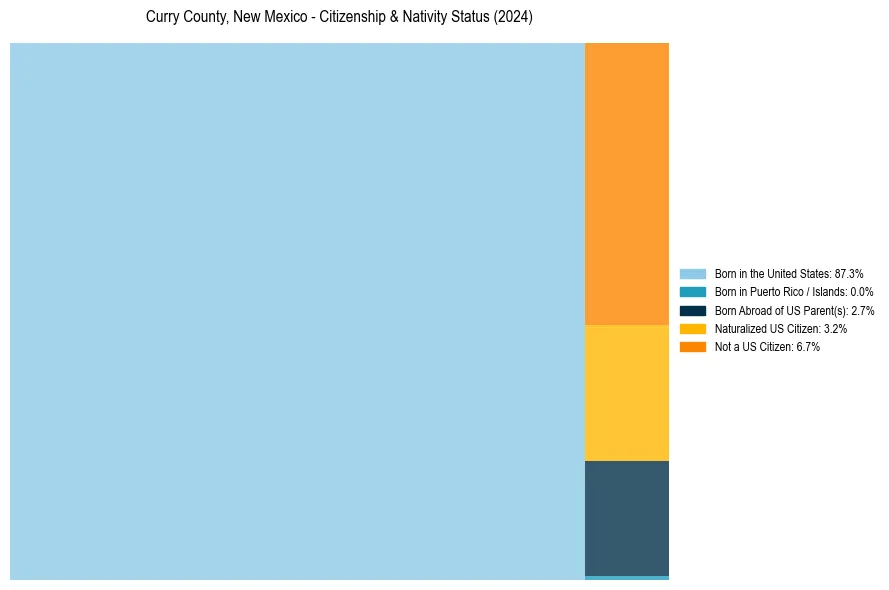
Curry County, New Mexico Nativity & Citizenship Indicators (2024)
Native Born
90.0%
Foreign Born
10.0%
Naturalized
3.2%
US Citizens
93.3%
Curry County, New Mexico Nativity & Citizenship Distribution
Curry County, New Mexico Historical Nativity Trends (2010–2024)
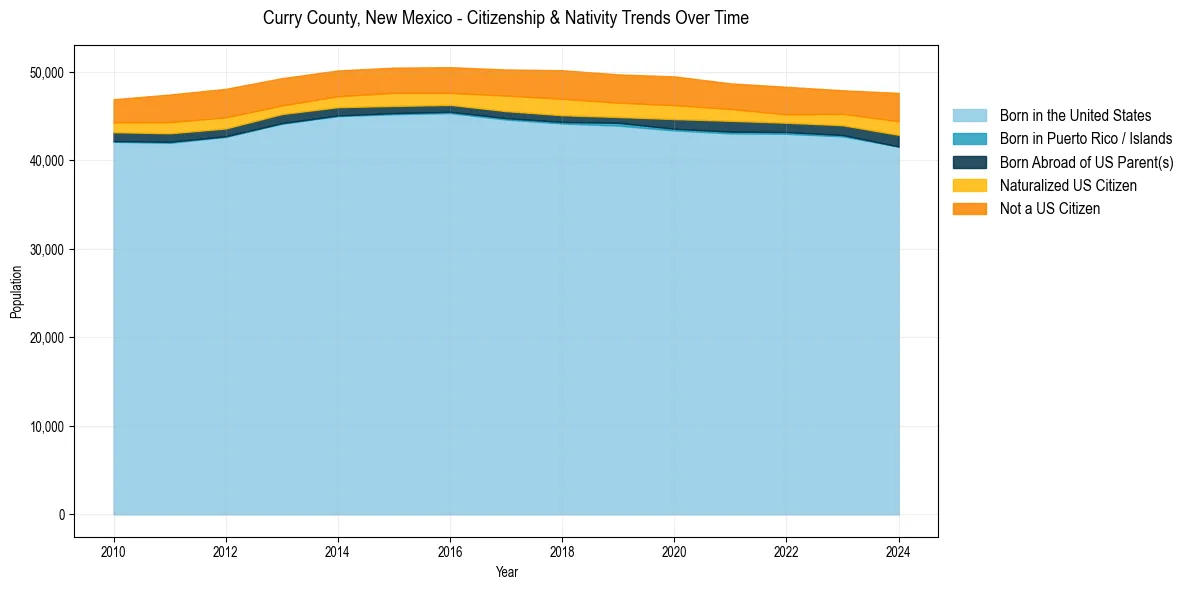
Curry County, New Mexico Population & Nativity History
| Year | Total Pop | Foreign Born | Native Born |
|---|---|---|---|
| 2024 | 47,638 | 10.0% | 90.0% |
| 2023 | 47,932 | 8.2% | 91.8% |
| 2022 | 48,327 | 8.4% | 91.6% |
| 2021 | 48,716 | 8.7% | 91.3% |
| 2020 | 49,502 | 9.7% | 90.3% |
| 2019 | 49,732 | 9.7% | 90.3% |
| 2018 | 50,199 | 10.1% | 89.9% |
| 2017 | 50,283 | 9.4% | 90.6% |
| 2016 | 50,544 | 8.4% | 91.6% |
| 2015 | 50,497 | 8.6% | 91.4% |
| 2014 | 50,173 | 8.3% | 91.7% |
| 2013 | 49,302 | 8.2% | 91.8% |
| 2012 | 48,101 | 9.3% | 90.7% |
| 2011 | 47,453 | 9.2% | 90.8% |
| 2010 | 46,924 | 7.9% | 92.1% |
Nativity & Citizenship FAQs for Curry County, New Mexico
Approximately 10.0% of residents in Curry County, New Mexico were born outside the United States.
The vast majority of residents, roughly 93.3%, are U.S. citizens (including both native-born and naturalized citizens).