Los Alamos County, New Mexico Nativity & Citizenship Status (2024)
Place of birth and citizenship status analysis for Los Alamos County, New Mexico
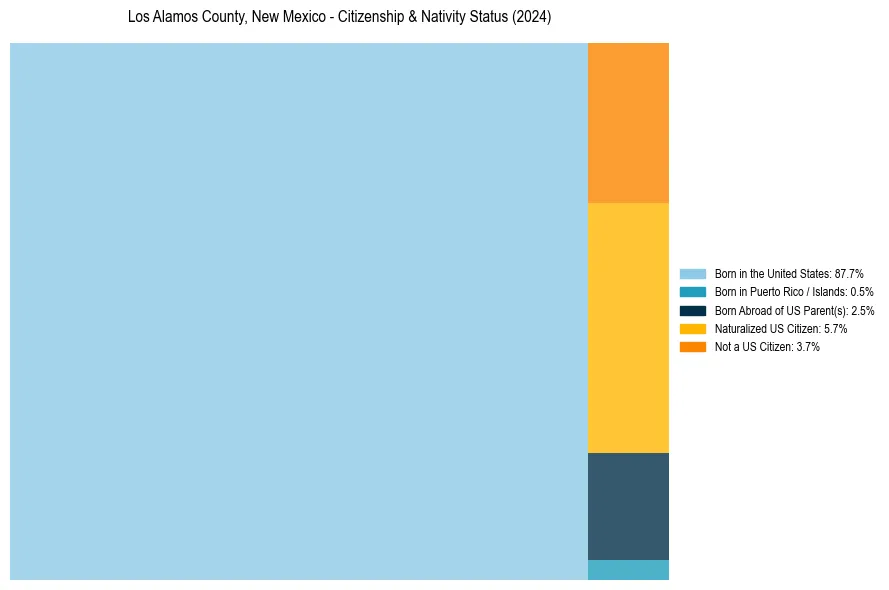
Los Alamos County, New Mexico Nativity & Citizenship Indicators (2024)
Native Born
90.6%
Foreign Born
9.4%
Naturalized
5.7%
US Citizens
96.3%
Los Alamos County, New Mexico Nativity & Citizenship Distribution
Los Alamos County, New Mexico Historical Nativity Trends (2010–2024)
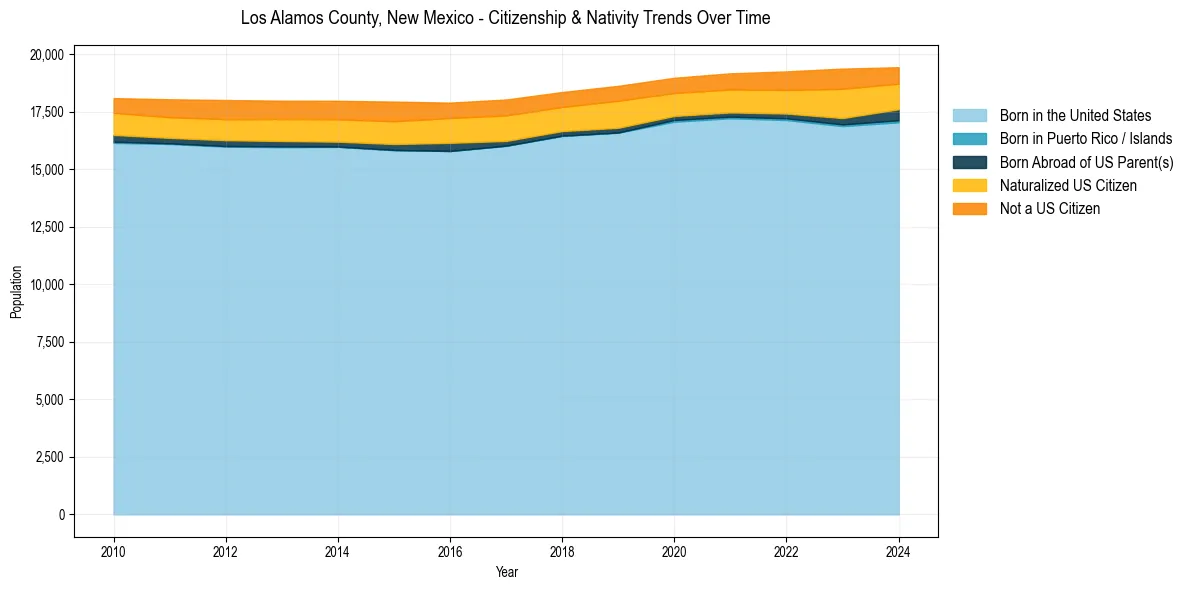
Los Alamos County, New Mexico Population & Nativity History
| Year | Total Pop | Foreign Born | Native Born |
|---|---|---|---|
| 2024 | 19,435 | 9.4% | 90.6% |
| 2023 | 19,374 | 11.1% | 88.9% |
| 2022 | 19,253 | 9.5% | 90.5% |
| 2021 | 19,169 | 8.9% | 91.1% |
| 2020 | 18,976 | 8.8% | 91.2% |
| 2019 | 18,625 | 9.8% | 90.2% |
| 2018 | 18,356 | 9.3% | 90.7% |
| 2017 | 18,031 | 10.0% | 90.0% |
| 2016 | 17,895 | 9.8% | 90.2% |
| 2015 | 17,939 | 10.3% | 89.7% |
| 2014 | 17,974 | 9.9% | 90.1% |
| 2013 | 17,979 | 9.7% | 90.3% |
| 2012 | 18,008 | 9.7% | 90.3% |
| 2011 | 18,040 | 9.3% | 90.7% |
| 2010 | 18,091 | 8.8% | 91.2% |
Nativity & Citizenship FAQs for Los Alamos County, New Mexico
Approximately 9.4% of residents in Los Alamos County, New Mexico were born outside the United States.
The vast majority of residents, roughly 96.3%, are U.S. citizens (including both native-born and naturalized citizens).