San Juan County, New Mexico Nativity & Citizenship Status (2024)
Place of birth and citizenship status analysis for San Juan County, New Mexico
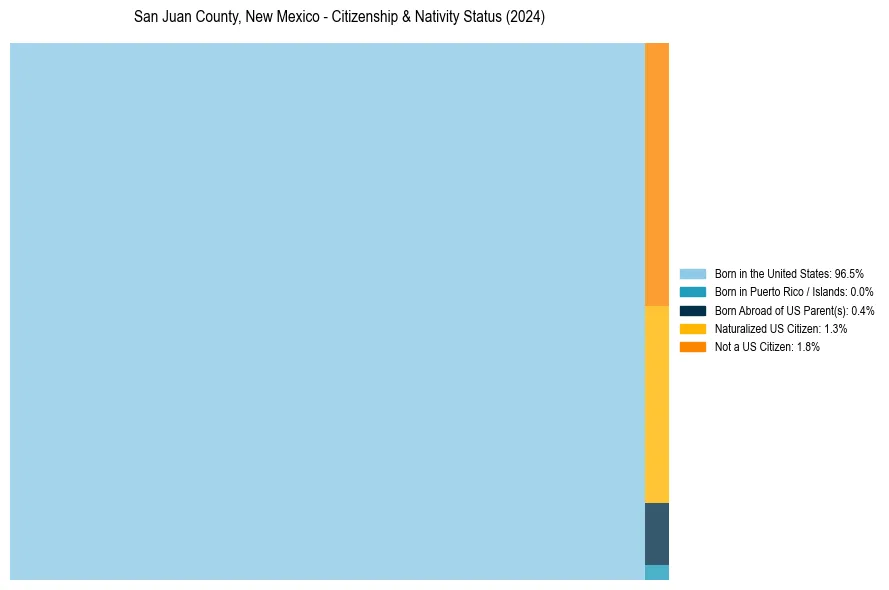
San Juan County, New Mexico Nativity & Citizenship Indicators (2024)
Native Born
96.9%
Foreign Born
3.1%
Naturalized
1.3%
US Citizens
98.2%
San Juan County, New Mexico Nativity & Citizenship Distribution
San Juan County, New Mexico Historical Nativity Trends (2010–2024)
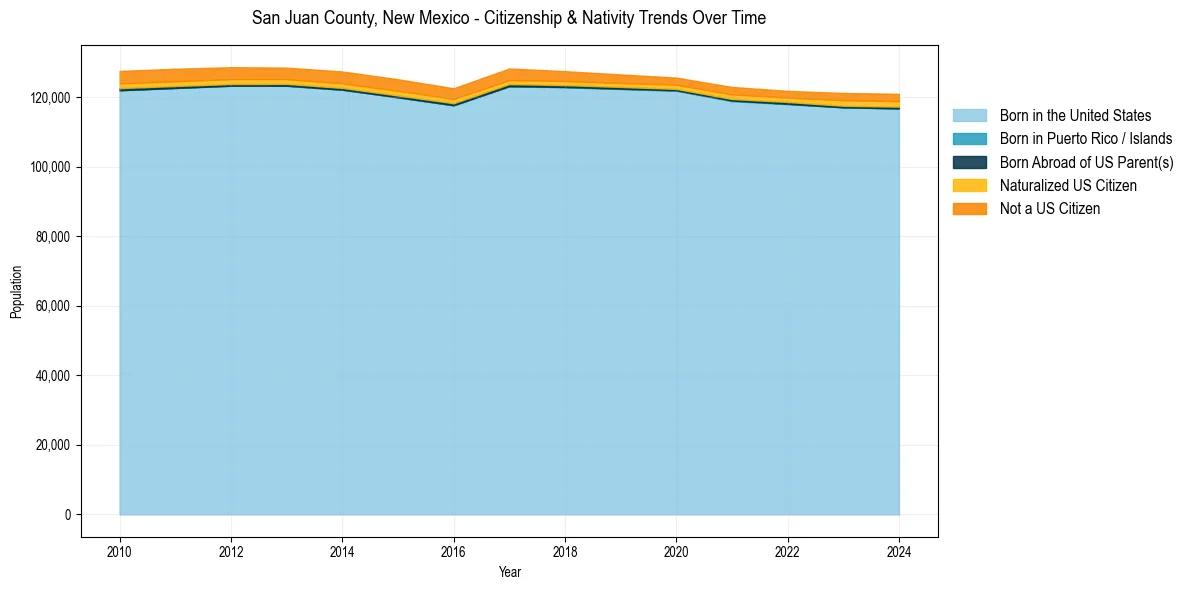
San Juan County, New Mexico Population & Nativity History
| Year | Total Pop | Foreign Born | Native Born |
|---|---|---|---|
| 2024 | 120,942 | 3.1% | 96.9% |
| 2023 | 121,178 | 3.0% | 97.0% |
| 2022 | 121,798 | 2.6% | 97.4% |
| 2021 | 122,912 | 2.8% | 97.2% |
| 2020 | 125,608 | 2.6% | 97.4% |
| 2019 | 126,515 | 2.8% | 97.2% |
| 2018 | 127,455 | 3.1% | 96.9% |
| 2017 | 128,221 | 3.5% | 96.5% |
| 2016 | 122,537 | 3.5% | 96.5% |
| 2015 | 125,133 | 3.7% | 96.3% |
| 2014 | 127,358 | 3.7% | 96.3% |
| 2013 | 128,476 | 3.6% | 96.4% |
| 2012 | 128,600 | 3.8% | 96.2% |
| 2011 | 128,160 | 3.9% | 96.1% |
| 2010 | 127,517 | 3.9% | 96.1% |
Nativity & Citizenship FAQs for San Juan County, New Mexico
Approximately 3.1% of residents in San Juan County, New Mexico were born outside the United States.
The vast majority of residents, roughly 98.2%, are U.S. citizens (including both native-born and naturalized citizens).