Sandoval County, New Mexico Nativity & Citizenship Status (2024)
Place of birth and citizenship status analysis for Sandoval County, New Mexico
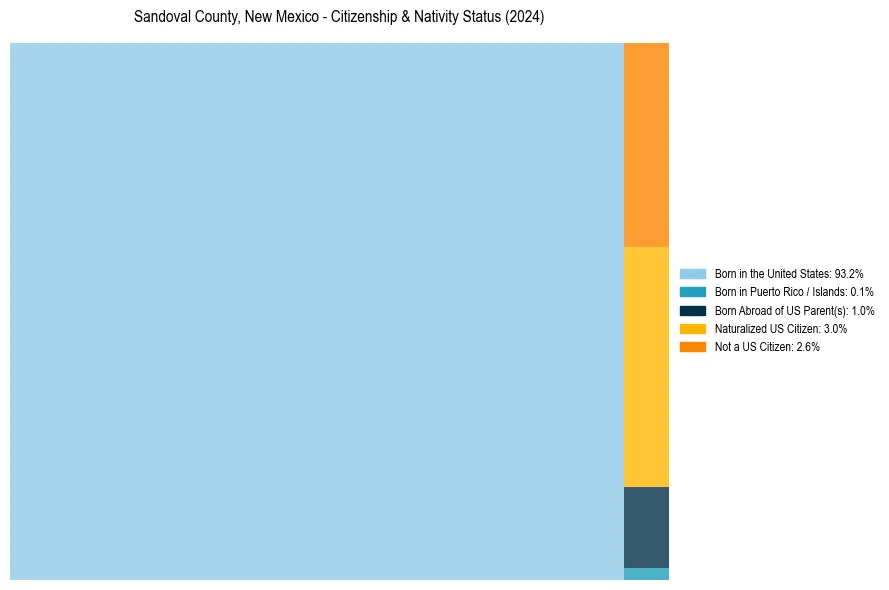
Sandoval County, New Mexico Nativity & Citizenship Indicators (2024)
Native Born
94.4%
Foreign Born
5.6%
Naturalized
3.0%
US Citizens
97.4%
Sandoval County, New Mexico Nativity & Citizenship Distribution
Sandoval County, New Mexico Historical Nativity Trends (2010–2024)
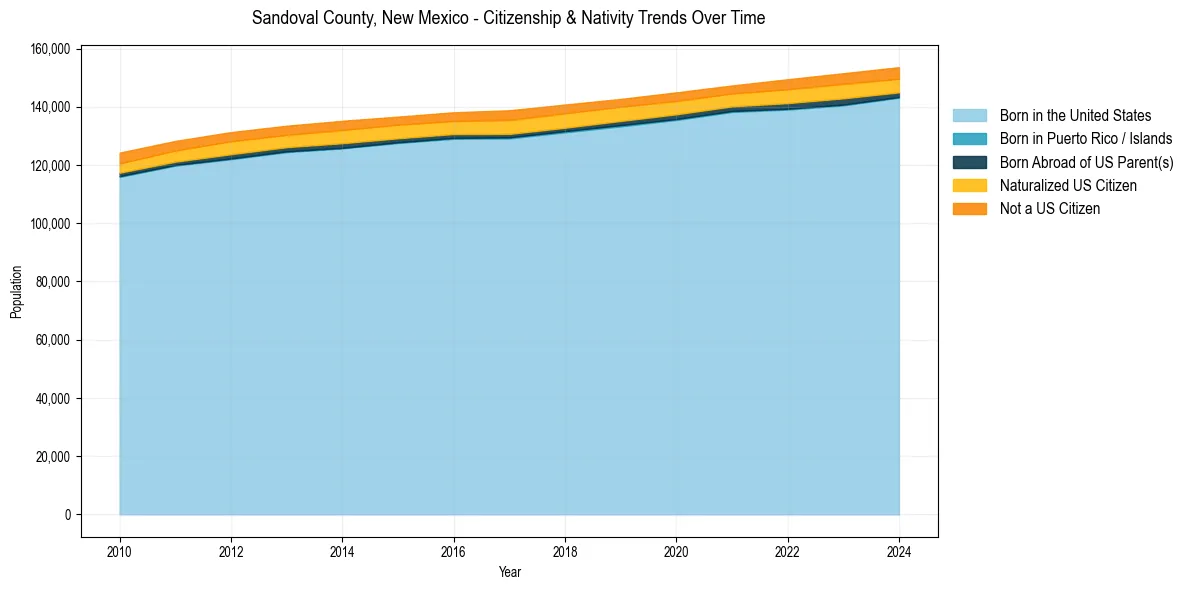
Sandoval County, New Mexico Population & Nativity History
| Year | Total Pop | Foreign Born | Native Born |
|---|---|---|---|
| 2024 | 153,604 | 5.6% | 94.4% |
| 2023 | 151,538 | 5.7% | 94.3% |
| 2022 | 149,460 | 5.5% | 94.5% |
| 2021 | 147,327 | 4.9% | 95.1% |
| 2020 | 144,954 | 5.2% | 94.8% |
| 2019 | 142,704 | 5.3% | 94.7% |
| 2018 | 140,769 | 5.7% | 94.3% |
| 2017 | 138,815 | 5.9% | 94.1% |
| 2016 | 138,117 | 5.4% | 94.6% |
| 2015 | 136,638 | 5.5% | 94.5% |
| 2014 | 135,191 | 5.7% | 94.3% |
| 2013 | 133,503 | 5.5% | 94.5% |
| 2012 | 131,302 | 5.8% | 94.2% |
| 2011 | 128,280 | 5.6% | 94.4% |
| 2010 | 124,263 | 5.6% | 94.4% |
Nativity & Citizenship FAQs for Sandoval County, New Mexico
Approximately 5.6% of residents in Sandoval County, New Mexico were born outside the United States.
The vast majority of residents, roughly 97.4%, are U.S. citizens (including both native-born and naturalized citizens).