Sierra County, New Mexico Nativity & Citizenship Status (2024)
Place of birth and citizenship status analysis for Sierra County, New Mexico
Sierra County, New Mexico Nativity & Citizenship Indicators (2024)
Native Born
92.5%
Foreign Born
7.5%
Naturalized
1.7%
US Citizens
94.2%
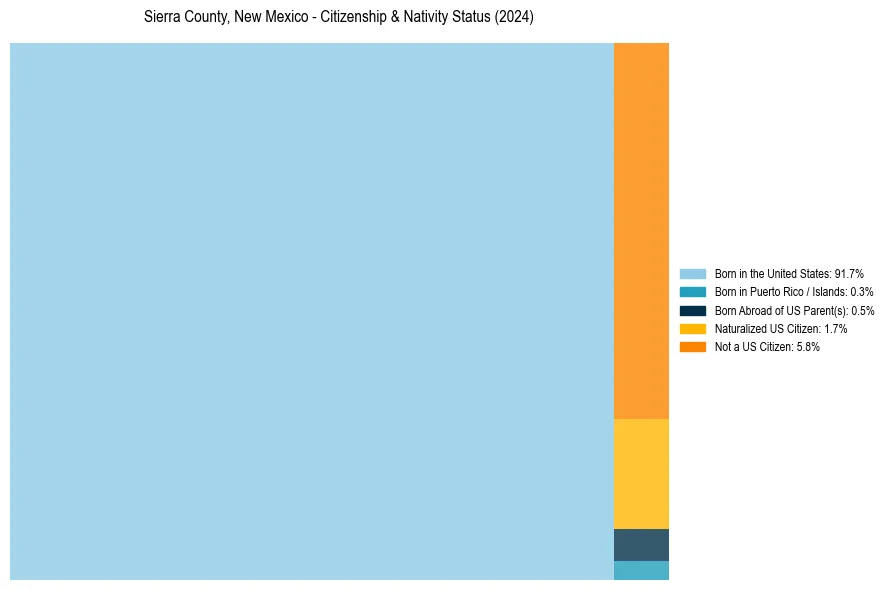
Sierra County, New Mexico Nativity & Citizenship Distribution
Sierra County, New Mexico Historical Nativity Trends (2010–2024)
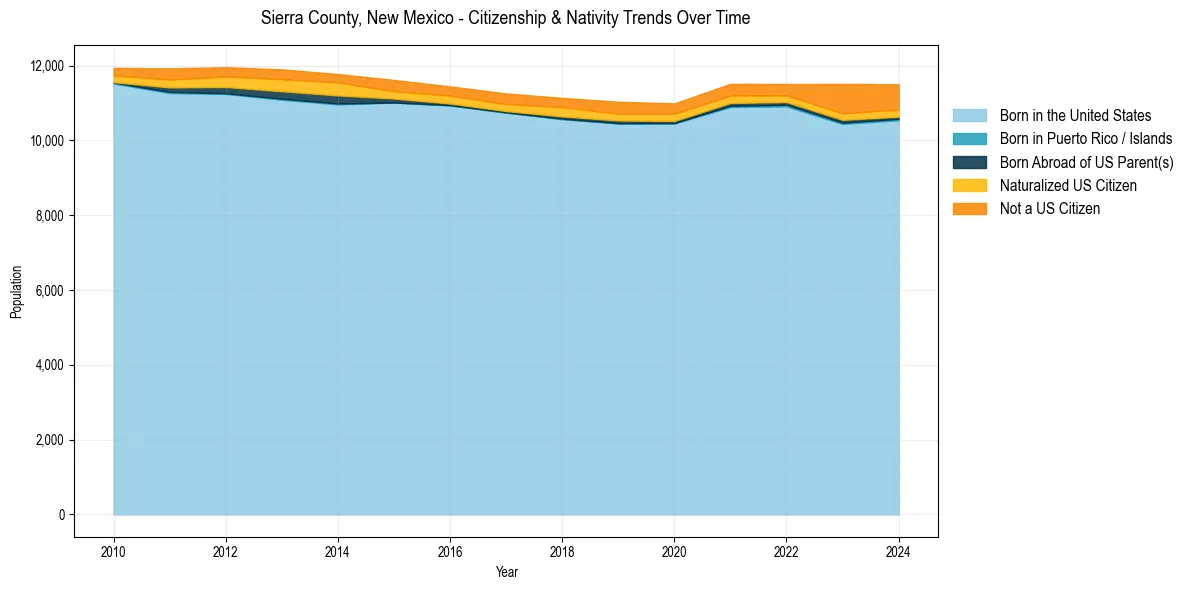
Sierra County, New Mexico Population & Nativity History
| Year | Total Pop | Foreign Born | Native Born |
|---|---|---|---|
| 2024 | 11,500 | 7.5% | 92.5% |
| 2023 | 11,511 | 8.4% | 91.6% |
| 2022 | 11,506 | 4.2% | 95.8% |
| 2021 | 11,512 | 4.4% | 95.6% |
| 2020 | 10,988 | 4.3% | 95.7% |
| 2019 | 11,031 | 4.5% | 95.5% |
| 2018 | 11,135 | 4.4% | 95.6% |
| 2017 | 11,254 | 4.2% | 95.8% |
| 2016 | 11,442 | 4.0% | 96.0% |
| 2015 | 11,615 | 4.3% | 95.7% |
| 2014 | 11,774 | 4.9% | 95.1% |
| 2013 | 11,898 | 4.9% | 95.1% |
| 2012 | 11,956 | 4.4% | 95.6% |
| 2011 | 11,925 | 4.3% | 95.7% |
| 2010 | 11,938 | 3.2% | 96.8% |
Nativity & Citizenship FAQs for Sierra County, New Mexico
Approximately 7.5% of residents in Sierra County, New Mexico were born outside the United States.
The vast majority of residents, roughly 94.2%, are U.S. citizens (including both native-born and naturalized citizens).