Alamance County, North Carolina Nativity & Citizenship Status (2024)
Place of birth and citizenship status analysis for Alamance County, North Carolina
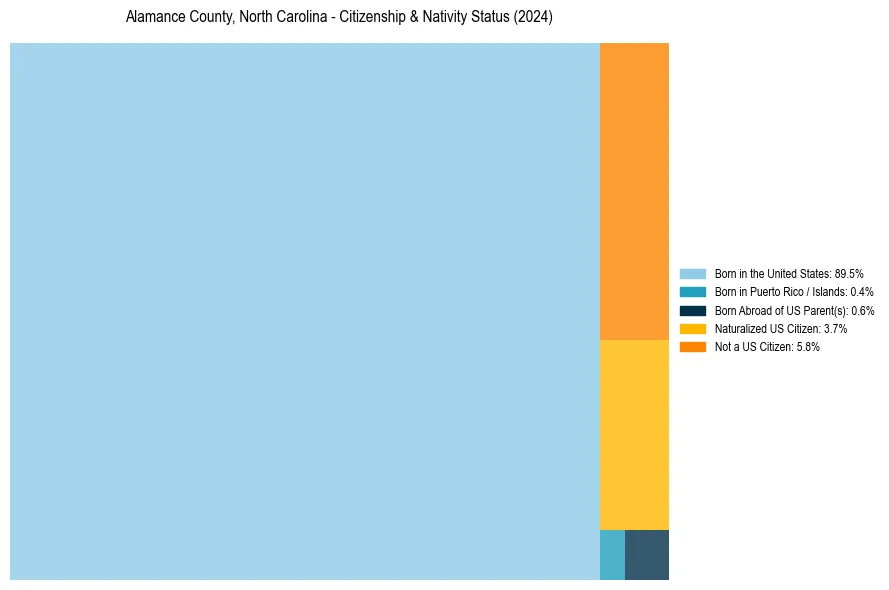
Alamance County, North Carolina Nativity & Citizenship Indicators (2024)
Native Born
90.5%
Foreign Born
9.5%
Naturalized
3.7%
US Citizens
94.2%
Alamance County, North Carolina Nativity & Citizenship Distribution
Alamance County, North Carolina Historical Nativity Trends (2010–2024)
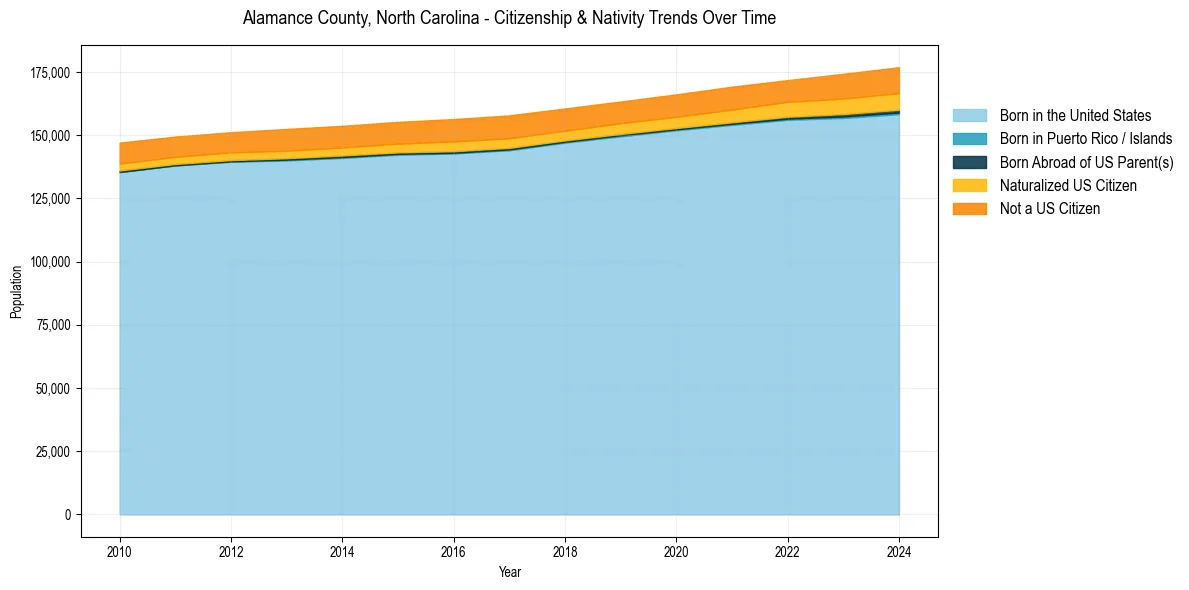
Alamance County, North Carolina Population & Nativity History
| Year | Total Pop | Foreign Born | Native Born |
|---|---|---|---|
| 2024 | 176,893 | 9.5% | 90.5% |
| 2023 | 174,286 | 9.1% | 90.9% |
| 2022 | 171,779 | 8.4% | 91.6% |
| 2021 | 169,185 | 8.3% | 91.7% |
| 2020 | 166,144 | 8.0% | 92.0% |
| 2019 | 163,324 | 7.9% | 92.1% |
| 2018 | 160,576 | 7.9% | 92.1% |
| 2017 | 157,844 | 8.2% | 91.8% |
| 2016 | 156,372 | 8.1% | 91.9% |
| 2015 | 155,258 | 7.8% | 92.2% |
| 2014 | 153,713 | 7.6% | 92.4% |
| 2013 | 152,472 | 7.6% | 92.4% |
| 2012 | 151,170 | 7.3% | 92.7% |
| 2011 | 149,439 | 7.3% | 92.7% |
| 2010 | 147,072 | 7.5% | 92.5% |
Nativity & Citizenship FAQs for Alamance County, North Carolina
Approximately 9.5% of residents in Alamance County, North Carolina were born outside the United States.
The vast majority of residents, roughly 94.2%, are U.S. citizens (including both native-born and naturalized citizens).