Brunswick County, North Carolina Nativity & Citizenship Status (2024)
Place of birth and citizenship status analysis for Brunswick County, North Carolina
Brunswick County, North Carolina Nativity & Citizenship Indicators (2024)
Native Born
96.4%
Foreign Born
3.6%
Naturalized
2.1%
US Citizens
98.5%
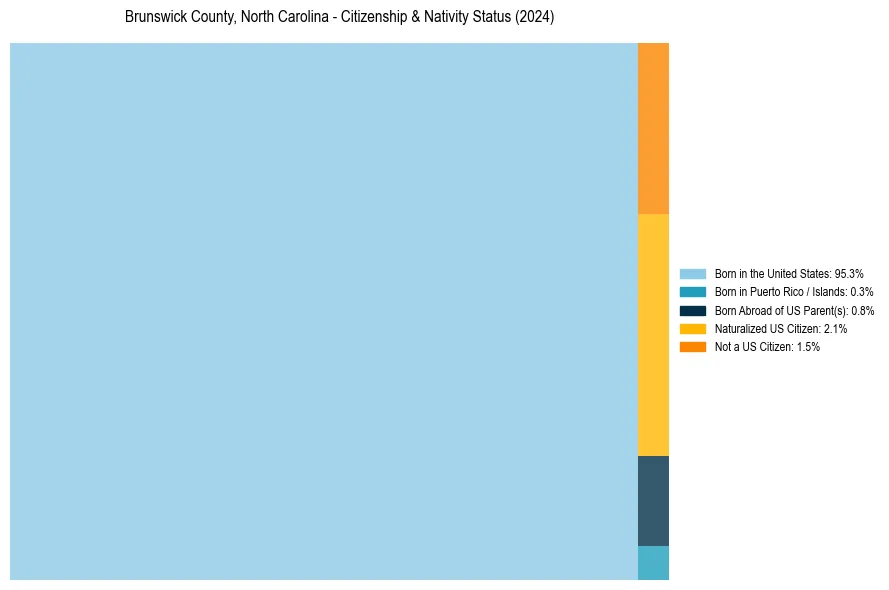
Brunswick County, North Carolina Nativity & Citizenship Distribution
Brunswick County, North Carolina Historical Nativity Trends (2010–2024)
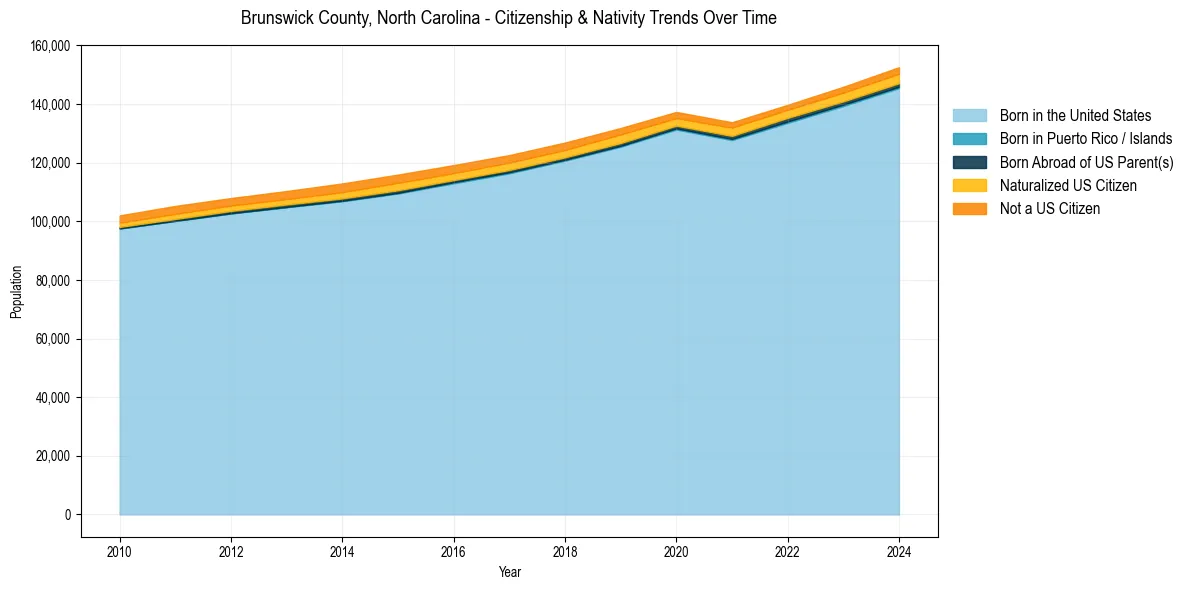
Brunswick County, North Carolina Population & Nativity History
| Year | Total Pop | Foreign Born | Native Born |
|---|---|---|---|
| 2024 | 152,568 | 3.6% | 96.4% |
| 2023 | 145,889 | 3.4% | 96.6% |
| 2022 | 139,721 | 3.2% | 96.8% |
| 2021 | 133,789 | 3.5% | 96.5% |
| 2020 | 137,303 | 3.4% | 96.6% |
| 2019 | 131,815 | 3.9% | 96.1% |
| 2018 | 126,860 | 4.0% | 96.0% |
| 2017 | 122,586 | 4.2% | 95.8% |
| 2016 | 119,167 | 4.3% | 95.7% |
| 2015 | 115,926 | 4.6% | 95.4% |
| 2014 | 112,907 | 4.5% | 95.5% |
| 2013 | 110,324 | 4.2% | 95.8% |
| 2012 | 107,925 | 4.1% | 95.9% |
| 2011 | 105,242 | 4.2% | 95.8% |
| 2010 | 101,994 | 3.9% | 96.1% |
Nativity & Citizenship FAQs for Brunswick County, North Carolina
Approximately 3.6% of residents in Brunswick County, North Carolina were born outside the United States.
The vast majority of residents, roughly 98.5%, are U.S. citizens (including both native-born and naturalized citizens).