Buncombe County, North Carolina Nativity & Citizenship Status (2024)
Place of birth and citizenship status analysis for Buncombe County, North Carolina
Buncombe County, North Carolina Nativity & Citizenship Indicators (2024)
Native Born
93.3%
Foreign Born
6.7%
Naturalized
2.9%
US Citizens
96.1%
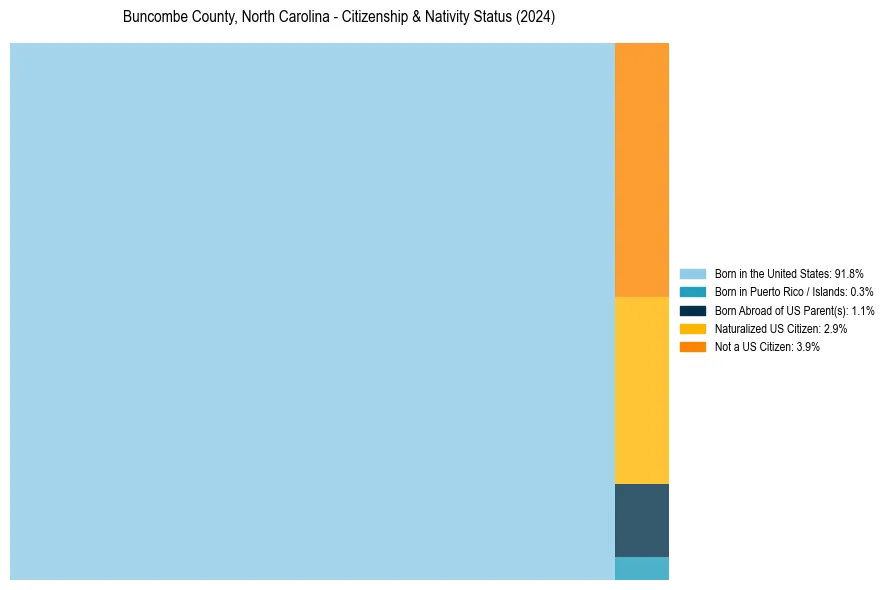
Buncombe County, North Carolina Nativity & Citizenship Distribution
Buncombe County, North Carolina Historical Nativity Trends (2010–2024)
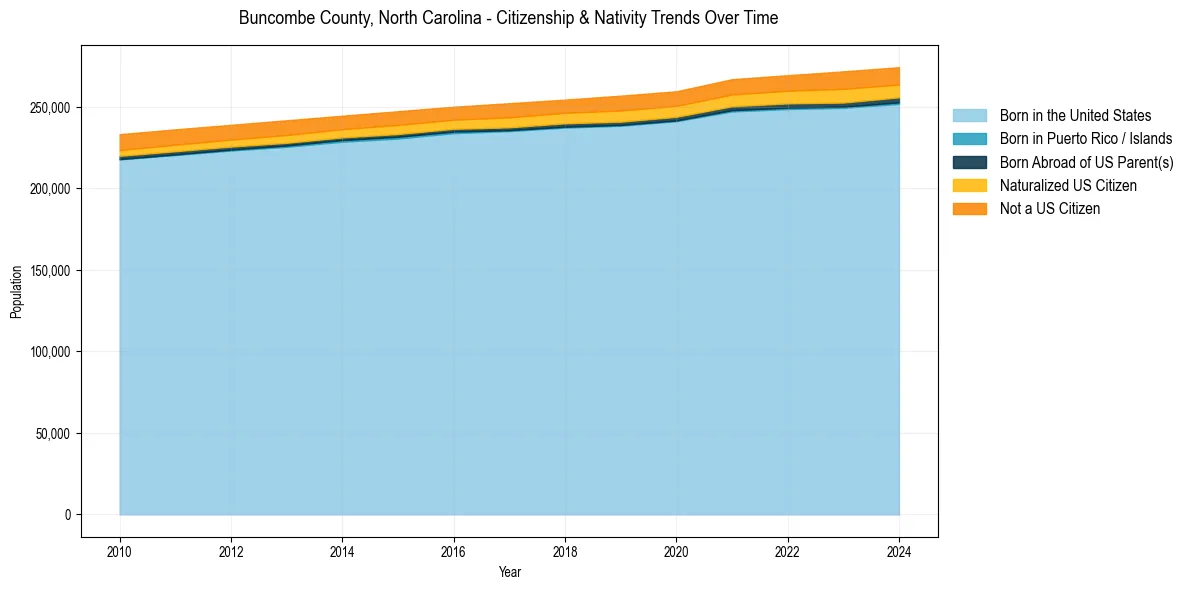
Buncombe County, North Carolina Population & Nativity History
| Year | Total Pop | Foreign Born | Native Born |
|---|---|---|---|
| 2024 | 274,360 | 6.7% | 93.3% |
| 2023 | 271,790 | 7.0% | 93.0% |
| 2022 | 269,449 | 6.4% | 93.6% |
| 2021 | 266,981 | 6.2% | 93.8% |
| 2020 | 259,576 | 6.0% | 94.0% |
| 2019 | 256,886 | 6.2% | 93.8% |
| 2018 | 254,474 | 5.7% | 94.3% |
| 2017 | 252,268 | 5.9% | 94.1% |
| 2016 | 250,112 | 5.4% | 94.6% |
| 2015 | 247,336 | 5.7% | 94.3% |
| 2014 | 244,599 | 5.4% | 94.6% |
| 2013 | 241,801 | 5.7% | 94.3% |
| 2012 | 239,000 | 5.6% | 94.4% |
| 2011 | 236,230 | 5.7% | 94.3% |
| 2010 | 233,249 | 5.7% | 94.3% |
Nativity & Citizenship FAQs for Buncombe County, North Carolina
Approximately 6.7% of residents in Buncombe County, North Carolina were born outside the United States.
The vast majority of residents, roughly 96.1%, are U.S. citizens (including both native-born and naturalized citizens).