Catawba County, North Carolina Nativity & Citizenship Status (2024)
Place of birth and citizenship status analysis for Catawba County, North Carolina
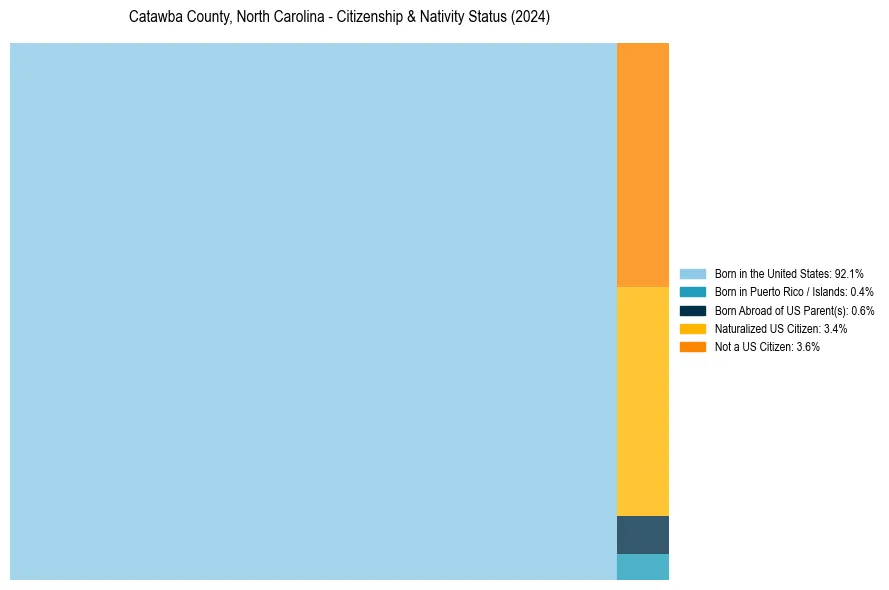
Catawba County, North Carolina Nativity & Citizenship Indicators (2024)
Native Born
93.1%
Foreign Born
6.9%
Naturalized
3.4%
US Citizens
96.4%
Catawba County, North Carolina Nativity & Citizenship Distribution
Catawba County, North Carolina Historical Nativity Trends (2010–2024)
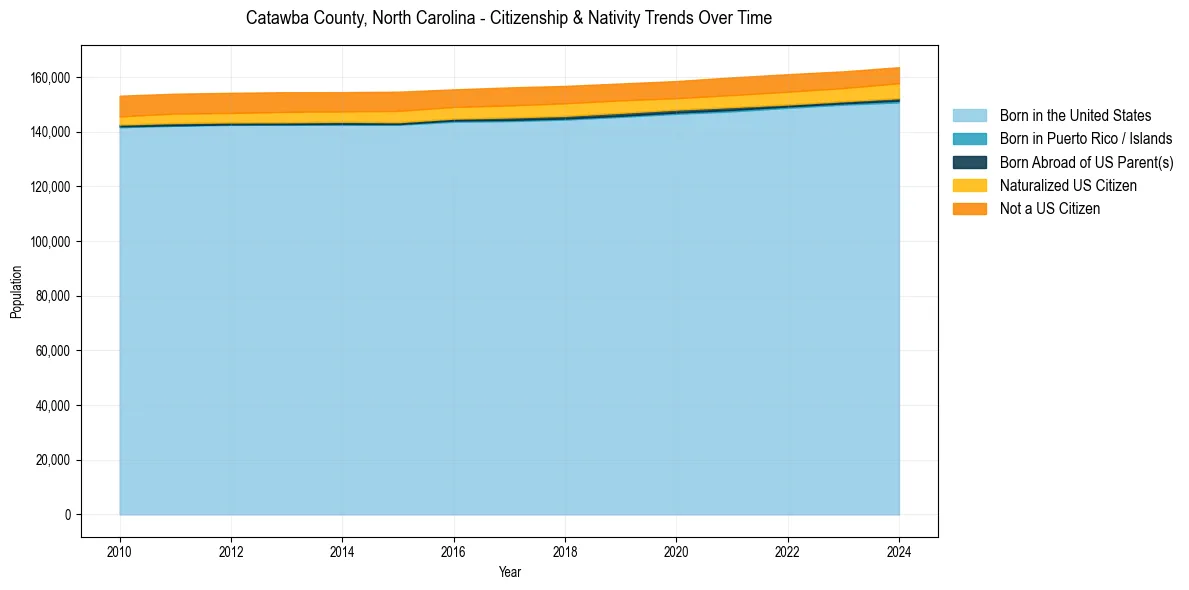
Catawba County, North Carolina Population & Nativity History
| Year | Total Pop | Foreign Born | Native Born |
|---|---|---|---|
| 2024 | 163,573 | 6.9% | 93.1% |
| 2023 | 162,051 | 6.7% | 93.3% |
| 2022 | 161,011 | 6.9% | 93.1% |
| 2021 | 159,852 | 6.8% | 93.2% |
| 2020 | 158,507 | 6.6% | 93.4% |
| 2019 | 157,613 | 6.8% | 93.2% |
| 2018 | 156,729 | 7.0% | 93.0% |
| 2017 | 156,182 | 7.0% | 93.0% |
| 2016 | 155,461 | 6.9% | 93.1% |
| 2015 | 154,610 | 7.2% | 92.8% |
| 2014 | 154,457 | 7.0% | 93.0% |
| 2013 | 154,432 | 7.1% | 92.9% |
| 2012 | 154,201 | 7.0% | 93.0% |
| 2011 | 153,886 | 7.0% | 93.0% |
| 2010 | 153,149 | 6.9% | 93.1% |
Nativity & Citizenship FAQs for Catawba County, North Carolina
Approximately 6.9% of residents in Catawba County, North Carolina were born outside the United States.
The vast majority of residents, roughly 96.4%, are U.S. citizens (including both native-born and naturalized citizens).