Chatham County, North Carolina Nativity & Citizenship Status (2024)
Place of birth and citizenship status analysis for Chatham County, North Carolina
Chatham County, North Carolina Nativity & Citizenship Indicators (2024)
Native Born
89.6%
Foreign Born
10.4%
Naturalized
3.8%
US Citizens
93.4%
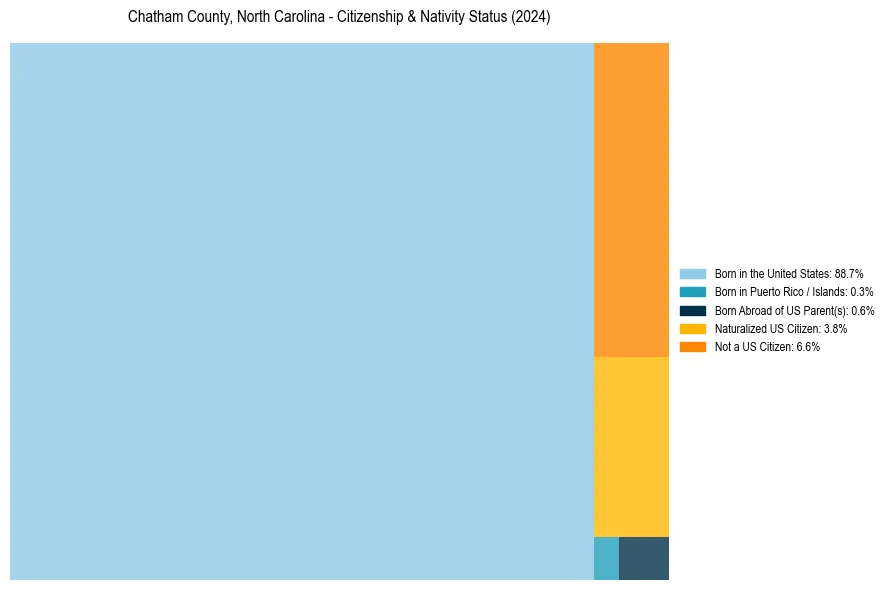
Chatham County, North Carolina Nativity & Citizenship Distribution
Chatham County, North Carolina Historical Nativity Trends (2010–2024)
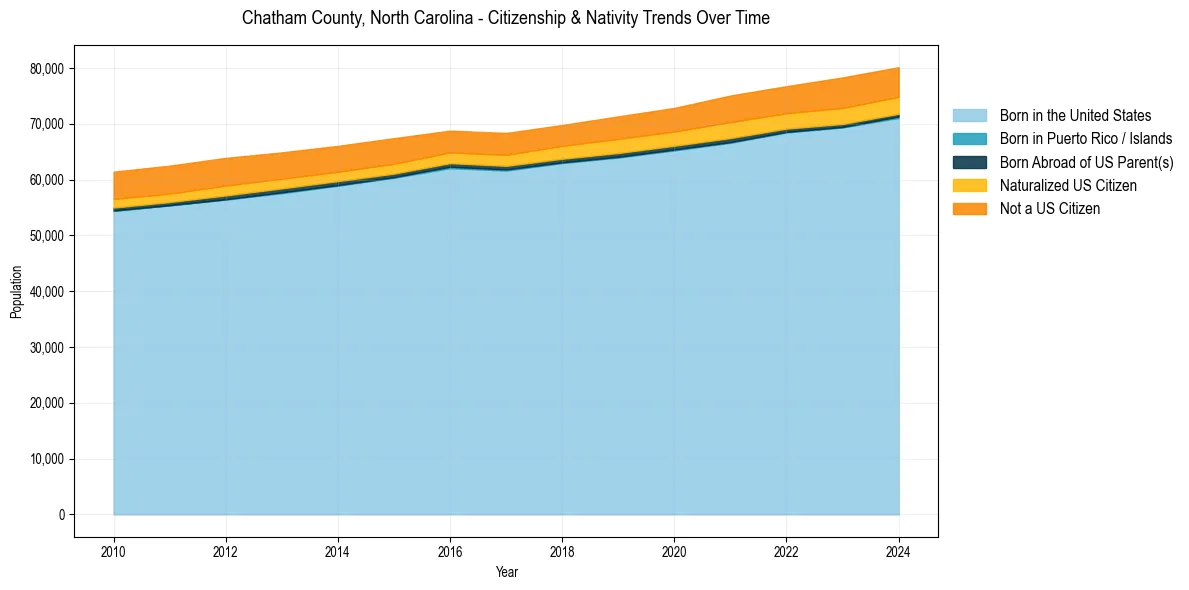
Chatham County, North Carolina Population & Nativity History
| Year | Total Pop | Foreign Born | Native Born |
|---|---|---|---|
| 2024 | 80,151 | 10.4% | 89.6% |
| 2023 | 78,319 | 10.7% | 89.3% |
| 2022 | 76,754 | 9.9% | 90.1% |
| 2021 | 75,070 | 10.2% | 89.8% |
| 2020 | 72,853 | 9.3% | 90.7% |
| 2019 | 71,338 | 9.2% | 90.8% |
| 2018 | 69,791 | 8.7% | 91.3% |
| 2017 | 68,364 | 8.6% | 91.4% |
| 2016 | 68,778 | 8.5% | 91.5% |
| 2015 | 67,431 | 9.4% | 90.6% |
| 2014 | 66,050 | 9.6% | 90.4% |
| 2013 | 64,886 | 10.0% | 90.0% |
| 2012 | 63,896 | 10.5% | 89.5% |
| 2011 | 62,506 | 10.4% | 89.6% |
| 2010 | 61,426 | 10.5% | 89.5% |
Nativity & Citizenship FAQs for Chatham County, North Carolina
Approximately 10.4% of residents in Chatham County, North Carolina were born outside the United States.
The vast majority of residents, roughly 93.4%, are U.S. citizens (including both native-born and naturalized citizens).