Cumberland County, North Carolina Nativity & Citizenship Status (2024)
Place of birth and citizenship status analysis for Cumberland County, North Carolina
Cumberland County, North Carolina Nativity & Citizenship Indicators (2024)
Native Born
93.2%
Foreign Born
6.8%
Naturalized
3.8%
US Citizens
97.0%
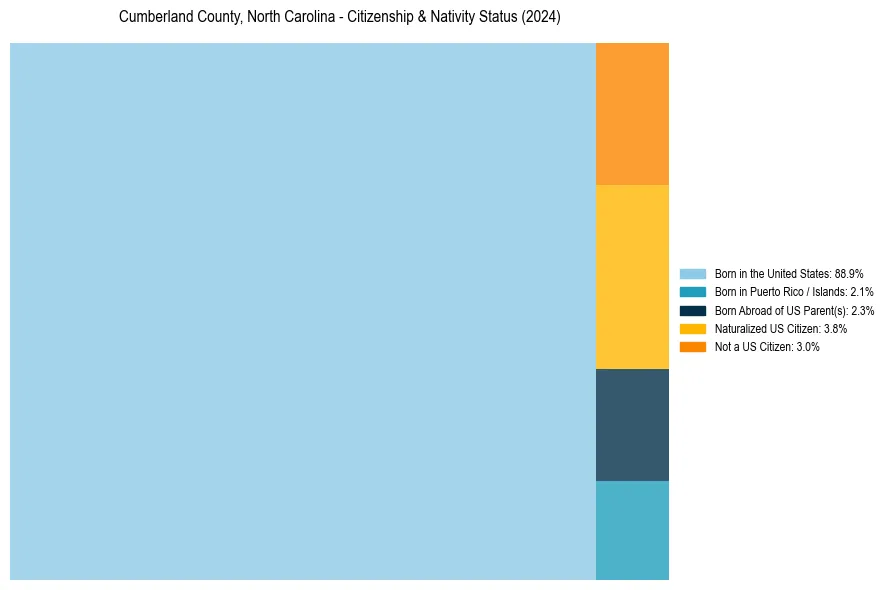
Cumberland County, North Carolina Nativity & Citizenship Distribution
Cumberland County, North Carolina Historical Nativity Trends (2010–2024)
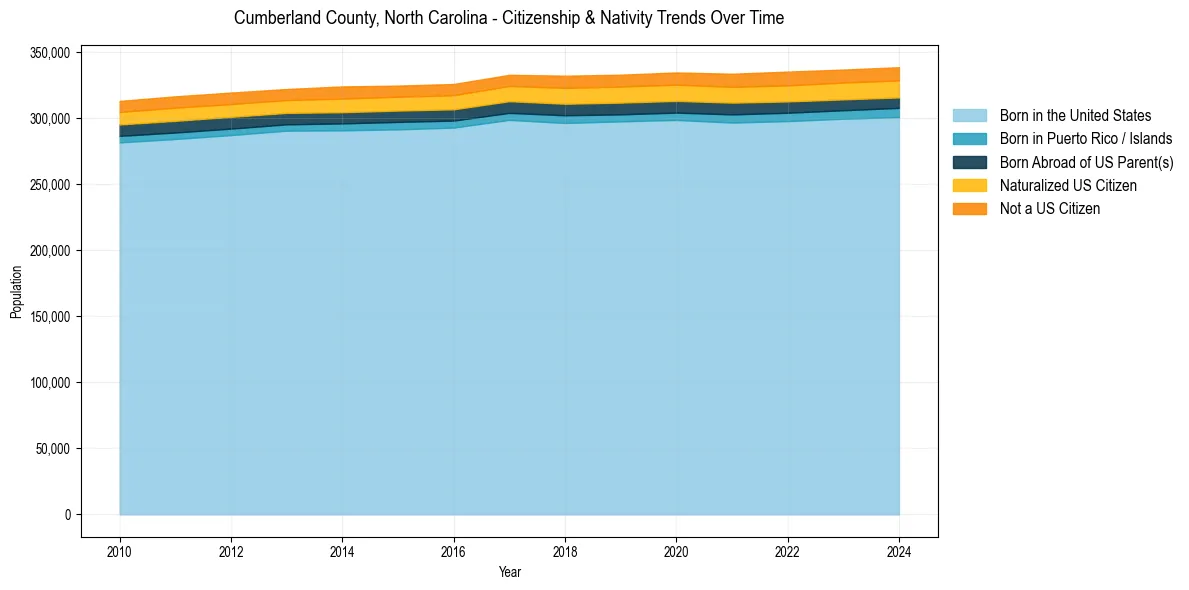
Cumberland County, North Carolina Population & Nativity History
| Year | Total Pop | Foreign Born | Native Born |
|---|---|---|---|
| 2024 | 338,545 | 6.8% | 93.2% |
| 2023 | 336,749 | 6.7% | 93.3% |
| 2022 | 335,207 | 6.7% | 93.3% |
| 2021 | 333,582 | 6.6% | 93.4% |
| 2020 | 334,562 | 6.4% | 93.6% |
| 2019 | 332,861 | 6.4% | 93.6% |
| 2018 | 332,106 | 6.4% | 93.6% |
| 2017 | 332,766 | 6.0% | 94.0% |
| 2016 | 325,841 | 5.9% | 94.1% |
| 2015 | 324,603 | 5.8% | 94.2% |
| 2014 | 324,002 | 6.0% | 94.0% |
| 2013 | 322,033 | 5.6% | 94.4% |
| 2012 | 319,329 | 5.8% | 94.2% |
| 2011 | 316,478 | 5.9% | 94.1% |
| 2010 | 312,994 | 5.7% | 94.3% |
Nativity & Citizenship FAQs for Cumberland County, North Carolina
Approximately 6.8% of residents in Cumberland County, North Carolina were born outside the United States.
The vast majority of residents, roughly 97.0%, are U.S. citizens (including both native-born and naturalized citizens).