Durham County, North Carolina Nativity & Citizenship Status (2024)
Place of birth and citizenship status analysis for Durham County, North Carolina
Durham County, North Carolina Nativity & Citizenship Indicators (2024)
Native Born
84.6%
Foreign Born
15.4%
Naturalized
5.8%
US Citizens
90.4%
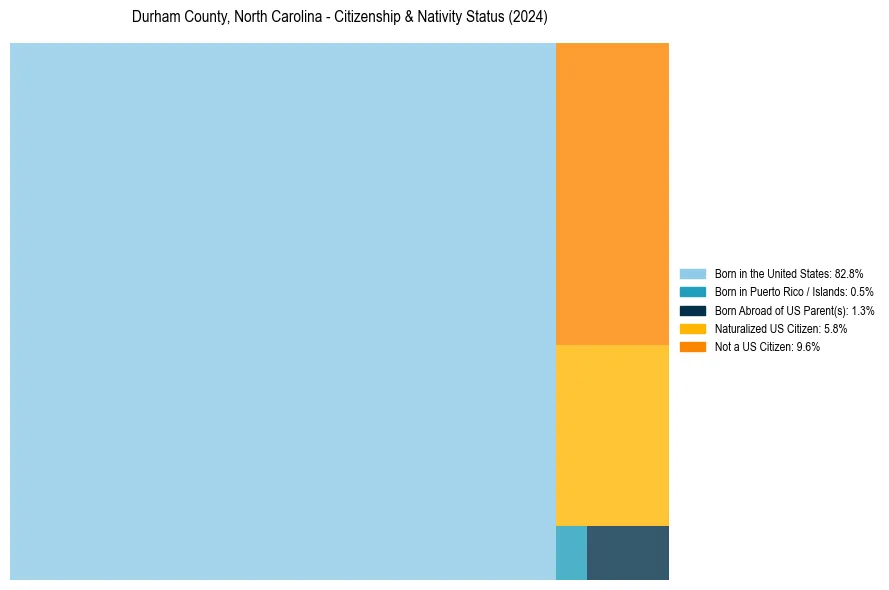
Durham County, North Carolina Nativity & Citizenship Distribution
Durham County, North Carolina Historical Nativity Trends (2010–2024)
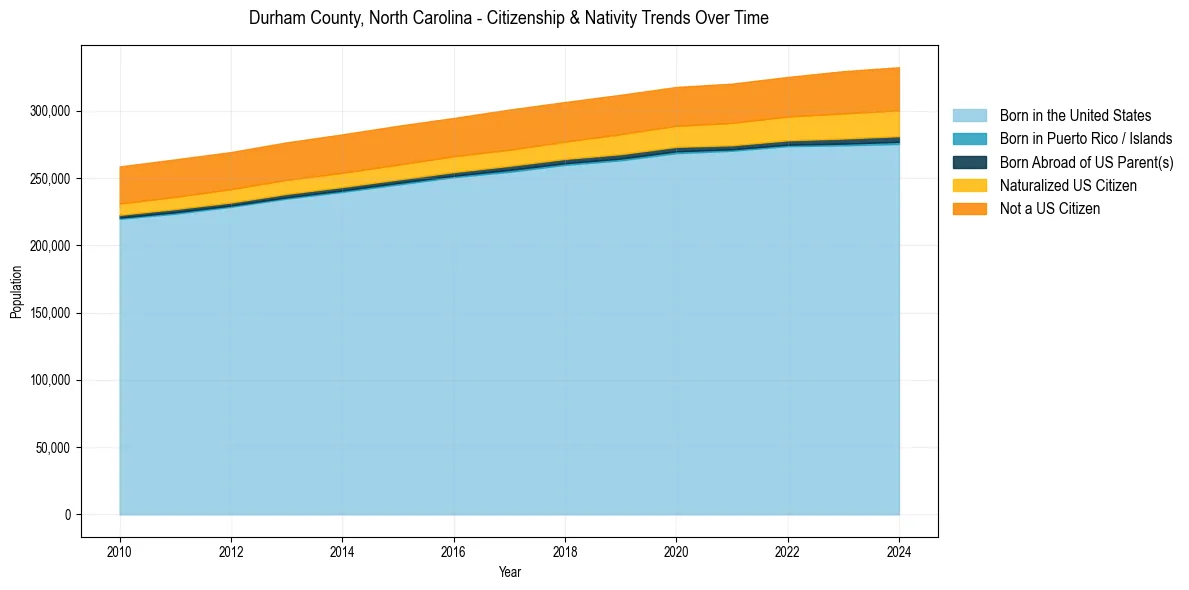
Durham County, North Carolina Population & Nativity History
| Year | Total Pop | Foreign Born | Native Born |
|---|---|---|---|
| 2024 | 332,353 | 15.4% | 84.6% |
| 2023 | 329,405 | 15.2% | 84.8% |
| 2022 | 325,101 | 14.5% | 85.5% |
| 2021 | 320,146 | 14.3% | 85.7% |
| 2020 | 317,665 | 14.0% | 86.0% |
| 2019 | 311,848 | 14.2% | 85.8% |
| 2018 | 306,457 | 13.8% | 86.2% |
| 2017 | 300,865 | 13.9% | 86.1% |
| 2016 | 294,618 | 13.7% | 86.3% |
| 2015 | 288,817 | 13.8% | 86.2% |
| 2014 | 282,422 | 13.9% | 86.1% |
| 2013 | 276,494 | 13.9% | 86.1% |
| 2012 | 269,283 | 13.9% | 86.1% |
| 2011 | 263,862 | 14.0% | 86.0% |
| 2010 | 258,578 | 13.9% | 86.1% |
Nativity & Citizenship FAQs for Durham County, North Carolina
Approximately 15.4% of residents in Durham County, North Carolina were born outside the United States.
The vast majority of residents, roughly 90.4%, are U.S. citizens (including both native-born and naturalized citizens).