Greene County, North Carolina Nativity & Citizenship Status (2024)
Place of birth and citizenship status analysis for Greene County, North Carolina
Greene County, North Carolina Nativity & Citizenship Indicators (2024)
Native Born
93.4%
Foreign Born
6.6%
Naturalized
1.1%
US Citizens
94.5%
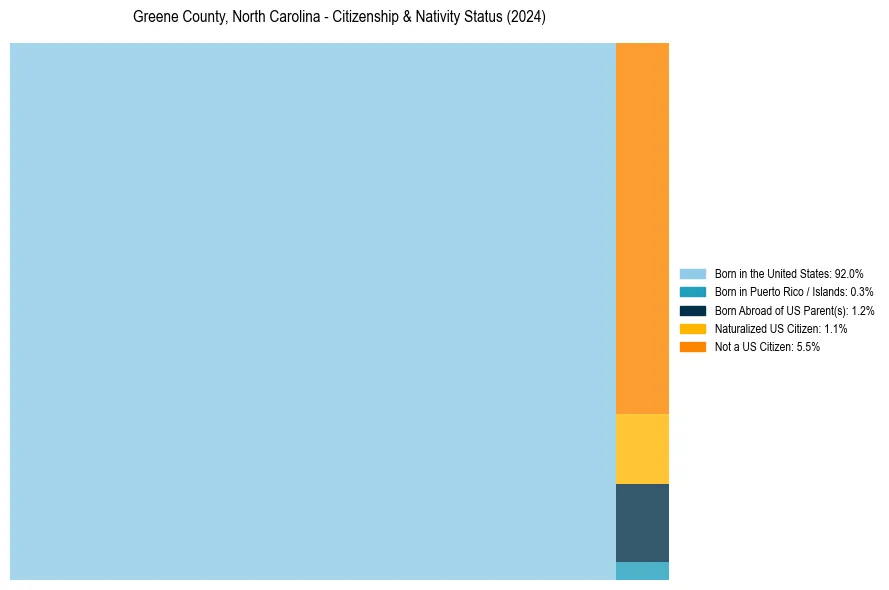
Greene County, North Carolina Nativity & Citizenship Distribution
Greene County, North Carolina Historical Nativity Trends (2010–2024)
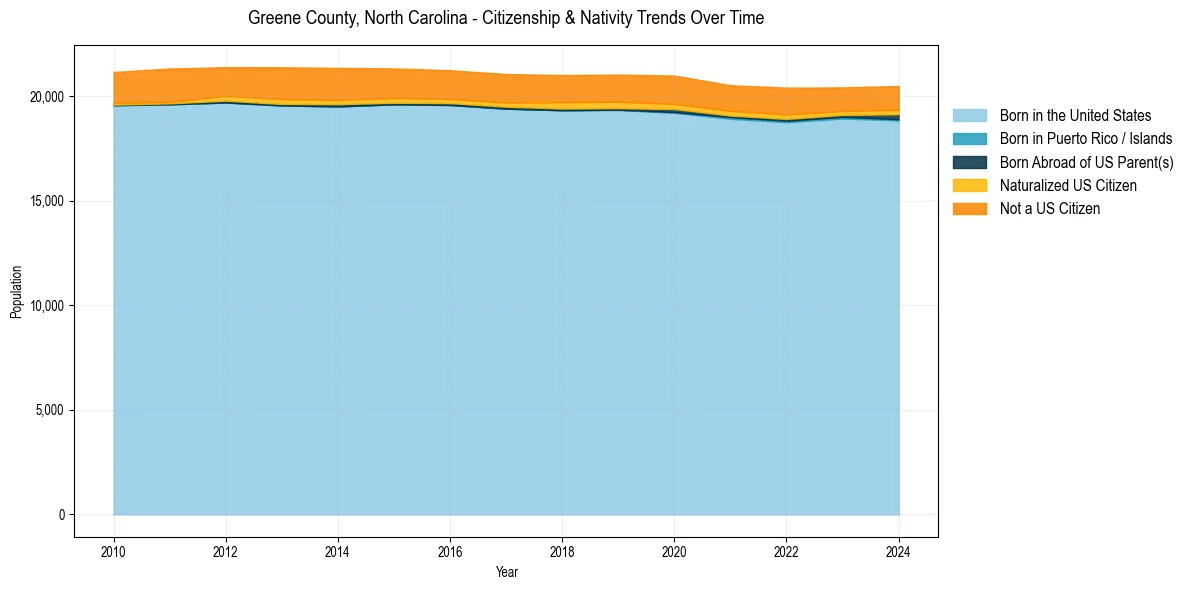
Greene County, North Carolina Population & Nativity History
| Year | Total Pop | Foreign Born | Native Born |
|---|---|---|---|
| 2024 | 20,486 | 6.6% | 93.4% |
| 2023 | 20,421 | 6.5% | 93.5% |
| 2022 | 20,407 | 7.3% | 92.7% |
| 2021 | 20,524 | 7.1% | 92.9% |
| 2020 | 20,987 | 7.6% | 92.4% |
| 2019 | 21,033 | 7.7% | 92.3% |
| 2018 | 21,008 | 7.6% | 92.4% |
| 2017 | 21,059 | 7.4% | 92.6% |
| 2016 | 21,241 | 7.4% | 92.6% |
| 2015 | 21,328 | 7.7% | 92.3% |
| 2014 | 21,353 | 8.1% | 91.9% |
| 2013 | 21,382 | 8.2% | 91.8% |
| 2012 | 21,386 | 7.5% | 92.5% |
| 2011 | 21,323 | 7.8% | 92.2% |
| 2010 | 21,157 | 7.4% | 92.6% |
Nativity & Citizenship FAQs for Greene County, North Carolina
Approximately 6.6% of residents in Greene County, North Carolina were born outside the United States.
The vast majority of residents, roughly 94.5%, are U.S. citizens (including both native-born and naturalized citizens).