Guilford County, North Carolina Nativity & Citizenship Status (2024)
Place of birth and citizenship status analysis for Guilford County, North Carolina
Guilford County, North Carolina Nativity & Citizenship Indicators (2024)
Native Born
88.2%
Foreign Born
11.8%
Naturalized
5.7%
US Citizens
93.9%
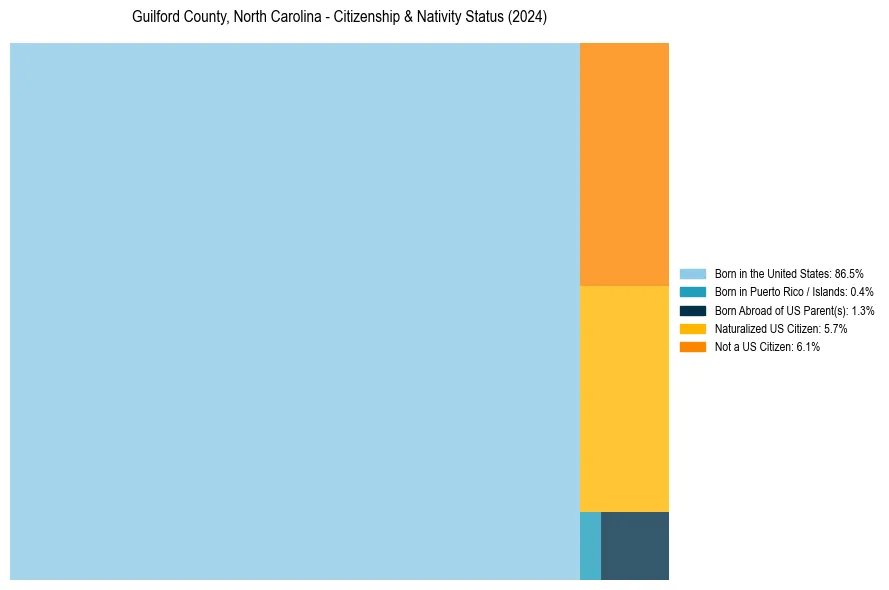
Guilford County, North Carolina Nativity & Citizenship Distribution
Guilford County, North Carolina Historical Nativity Trends (2010–2024)
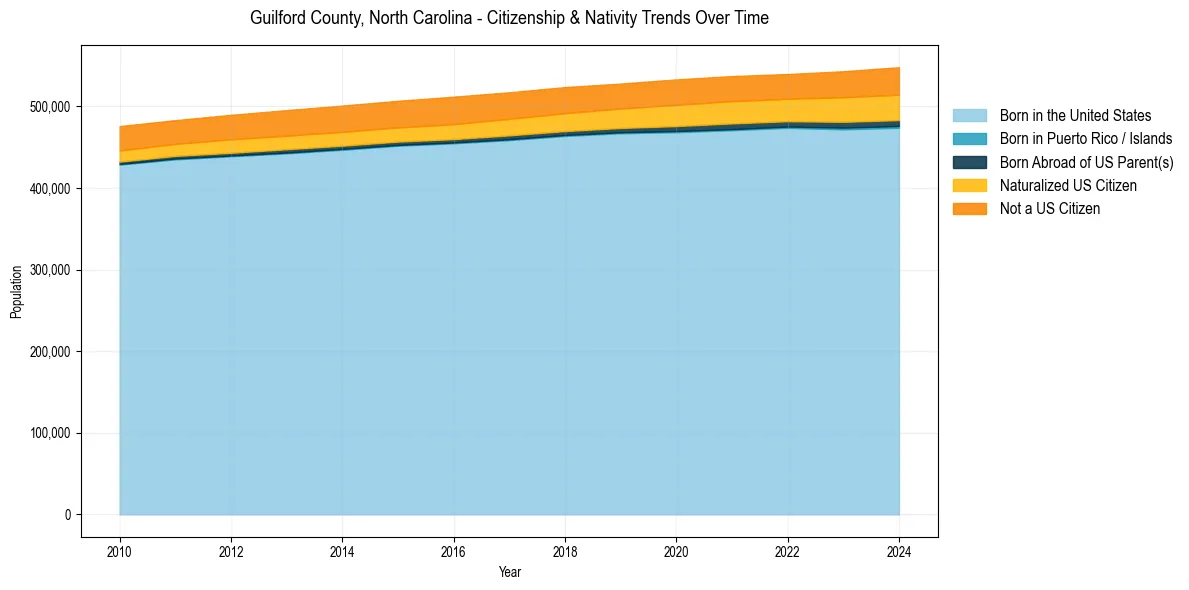
Guilford County, North Carolina Population & Nativity History
| Year | Total Pop | Foreign Born | Native Born |
|---|---|---|---|
| 2024 | 547,940 | 11.8% | 88.2% |
| 2023 | 542,987 | 11.4% | 88.6% |
| 2022 | 539,557 | 10.7% | 89.3% |
| 2021 | 537,113 | 10.8% | 89.2% |
| 2020 | 532,956 | 10.7% | 89.3% |
| 2019 | 527,868 | 10.3% | 89.7% |
| 2018 | 523,582 | 10.3% | 89.7% |
| 2017 | 517,197 | 10.2% | 89.8% |
| 2016 | 511,815 | 10.2% | 89.8% |
| 2015 | 506,763 | 9.9% | 90.1% |
| 2014 | 500,899 | 9.8% | 90.2% |
| 2013 | 495,326 | 9.7% | 90.3% |
| 2012 | 489,576 | 9.5% | 90.5% |
| 2011 | 483,081 | 9.1% | 90.9% |
| 2010 | 475,786 | 9.1% | 90.9% |
Nativity & Citizenship FAQs for Guilford County, North Carolina
Approximately 11.8% of residents in Guilford County, North Carolina were born outside the United States.
The vast majority of residents, roughly 93.9%, are U.S. citizens (including both native-born and naturalized citizens).