Harnett County, North Carolina Nativity & Citizenship Status (2024)
Place of birth and citizenship status analysis for Harnett County, North Carolina
Harnett County, North Carolina Nativity & Citizenship Indicators (2024)
Native Born
93.5%
Foreign Born
6.5%
Naturalized
2.8%
US Citizens
96.3%
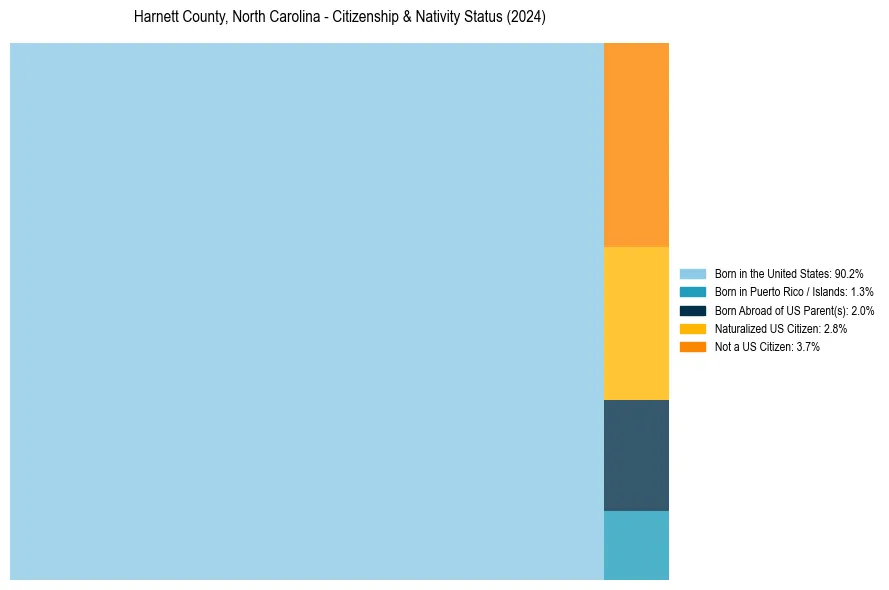
Harnett County, North Carolina Nativity & Citizenship Distribution
Harnett County, North Carolina Historical Nativity Trends (2010–2024)
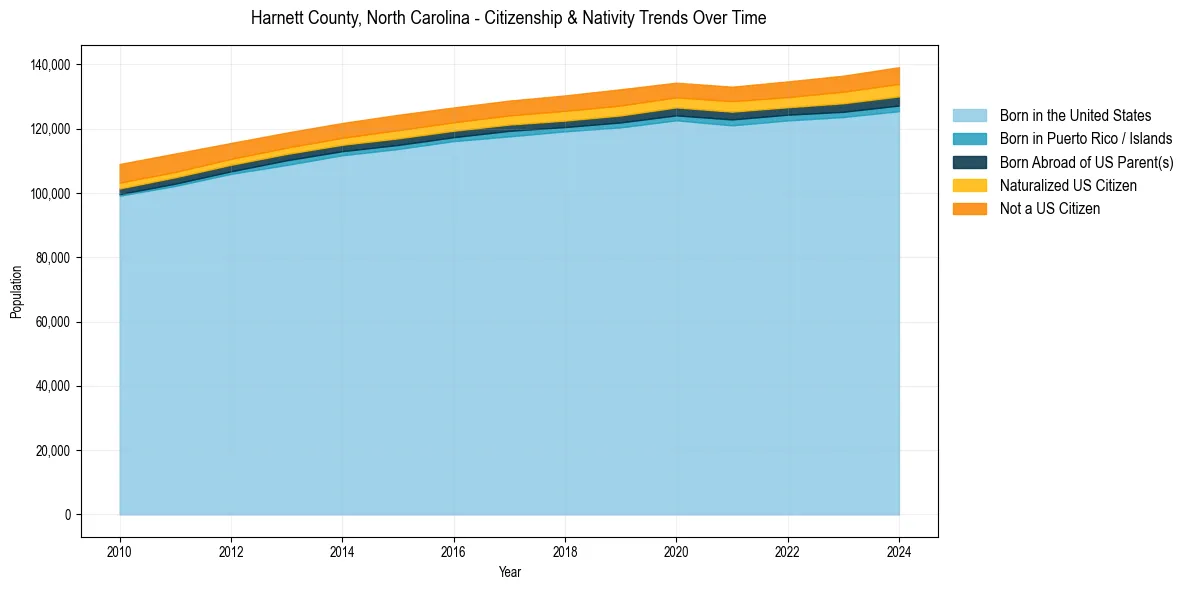
Harnett County, North Carolina Population & Nativity History
| Year | Total Pop | Foreign Born | Native Born |
|---|---|---|---|
| 2024 | 139,150 | 6.5% | 93.5% |
| 2023 | 136,503 | 6.3% | 93.7% |
| 2022 | 134,718 | 6.0% | 94.0% |
| 2021 | 133,074 | 5.8% | 94.2% |
| 2020 | 134,328 | 5.7% | 94.3% |
| 2019 | 132,283 | 6.2% | 93.8% |
| 2018 | 130,361 | 6.0% | 94.0% |
| 2017 | 128,753 | 5.8% | 94.2% |
| 2016 | 126,620 | 5.7% | 94.3% |
| 2015 | 124,320 | 5.9% | 94.1% |
| 2014 | 121,789 | 5.6% | 94.4% |
| 2013 | 118,793 | 5.6% | 94.4% |
| 2012 | 115,559 | 5.9% | 94.1% |
| 2011 | 112,287 | 6.6% | 93.4% |
| 2010 | 109,031 | 7.0% | 93.0% |
Nativity & Citizenship FAQs for Harnett County, North Carolina
Approximately 6.5% of residents in Harnett County, North Carolina were born outside the United States.
The vast majority of residents, roughly 96.3%, are U.S. citizens (including both native-born and naturalized citizens).