Moore County, North Carolina Nativity & Citizenship Status (2024)
Place of birth and citizenship status analysis for Moore County, North Carolina
Moore County, North Carolina Nativity & Citizenship Indicators (2024)
Native Born
94.9%
Foreign Born
5.1%
Naturalized
2.9%
US Citizens
97.8%
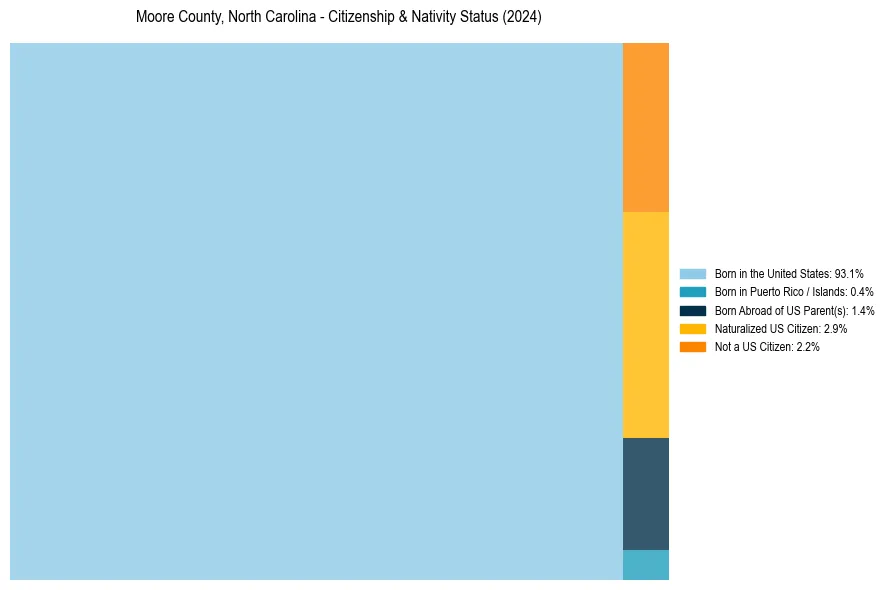
Moore County, North Carolina Nativity & Citizenship Distribution
Moore County, North Carolina Historical Nativity Trends (2010–2024)
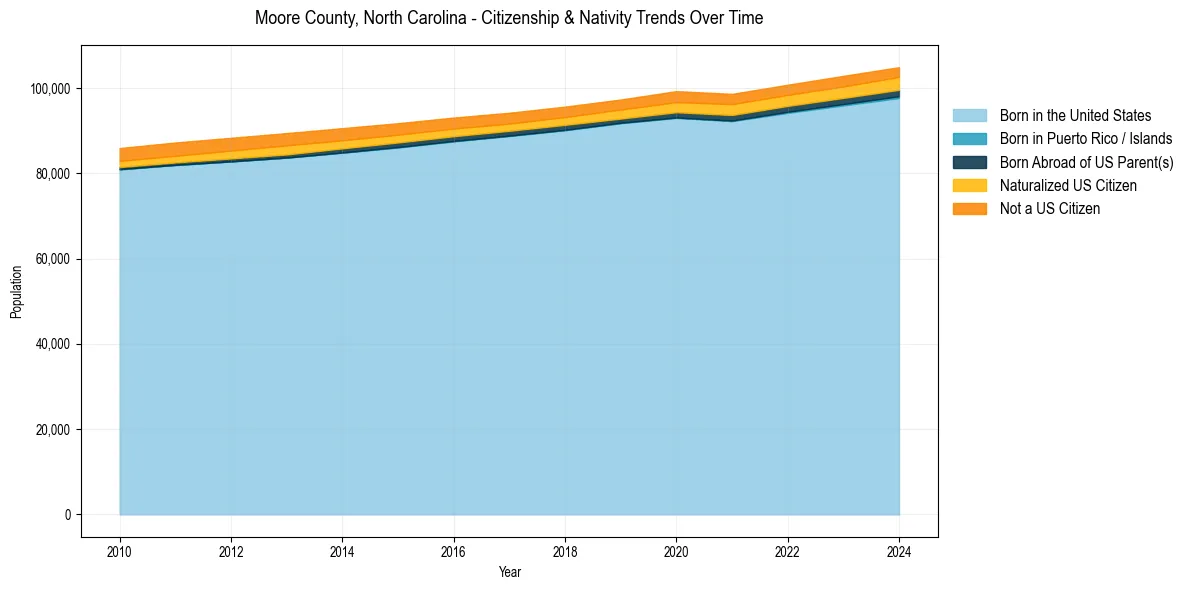
Moore County, North Carolina Population & Nativity History
| Year | Total Pop | Foreign Born | Native Born |
|---|---|---|---|
| 2024 | 104,876 | 5.1% | 94.9% |
| 2023 | 102,840 | 5.0% | 95.0% |
| 2022 | 100,759 | 4.9% | 95.1% |
| 2021 | 98,618 | 5.0% | 95.0% |
| 2020 | 99,263 | 5.0% | 95.0% |
| 2019 | 97,294 | 4.6% | 95.4% |
| 2018 | 95,629 | 4.5% | 95.5% |
| 2017 | 94,191 | 4.5% | 95.5% |
| 2016 | 93,070 | 4.7% | 95.3% |
| 2015 | 91,743 | 4.9% | 95.1% |
| 2014 | 90,579 | 5.2% | 94.8% |
| 2013 | 89,425 | 5.6% | 94.4% |
| 2012 | 88,314 | 5.5% | 94.5% |
| 2011 | 87,216 | 5.4% | 94.6% |
| 2010 | 85,914 | 5.2% | 94.8% |
Nativity & Citizenship FAQs for Moore County, North Carolina
Approximately 5.1% of residents in Moore County, North Carolina were born outside the United States.
The vast majority of residents, roughly 97.8%, are U.S. citizens (including both native-born and naturalized citizens).