North Carolina Nativity & Citizenship Status (2024)
Place of birth and citizenship status analysis for North Carolina
North Carolina Nativity & Citizenship Indicators (2024)
Native Born
90.9%
Foreign Born
9.1%
Naturalized
3.8%
US Citizens
94.8%
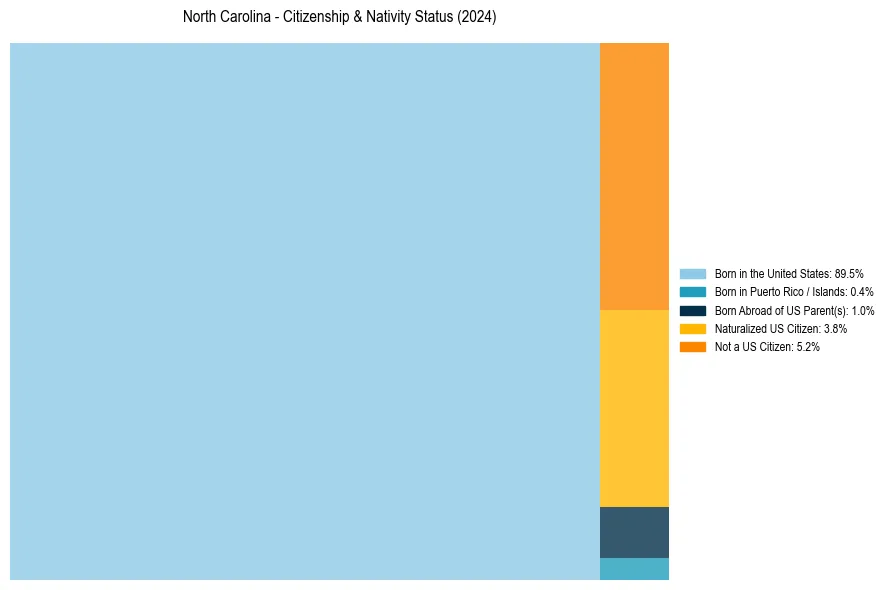
North Carolina Nativity & Citizenship Distribution
North Carolina Historical Nativity Trends (2010–2024)
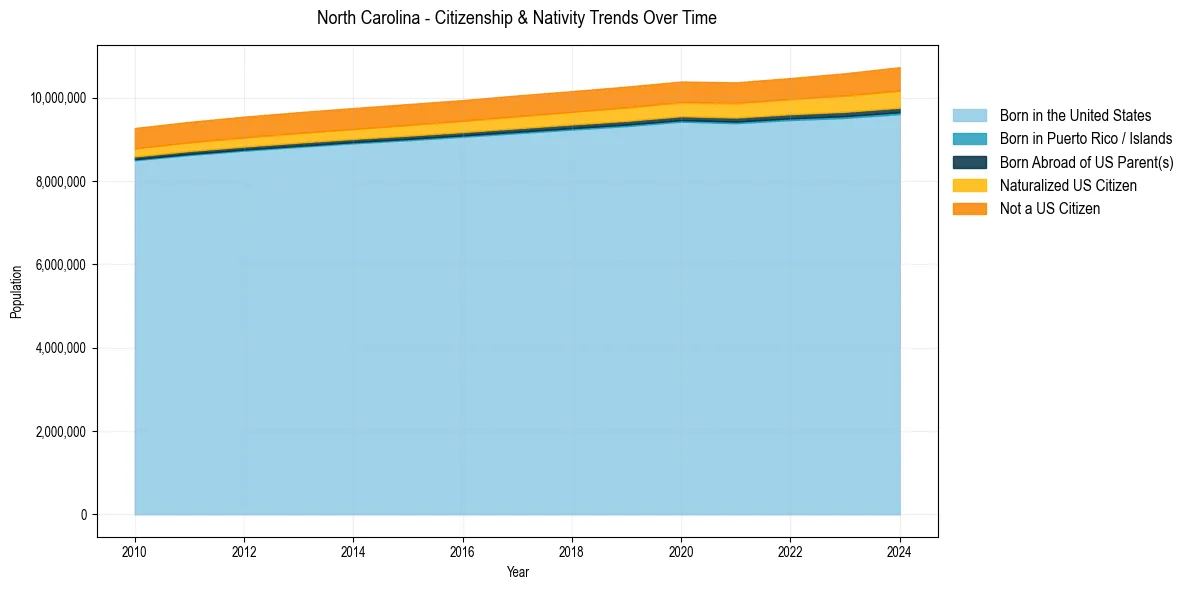
North Carolina Population & Nativity History
| Year | Total Pop | Foreign Born | Native Born |
|---|---|---|---|
| 2024 | 10,730,404 | 9.1% | 90.9% |
| 2023 | 10,584,340 | 8.7% | 91.3% |
| 2022 | 10,470,214 | 8.3% | 91.7% |
| 2021 | 10,367,022 | 8.2% | 91.8% |
| 2020 | 10,386,227 | 8.0% | 92.0% |
| 2019 | 10,264,876 | 8.0% | 92.0% |
| 2018 | 10,155,624 | 7.9% | 92.1% |
| 2017 | 10,052,564 | 7.8% | 92.2% |
| 2016 | 9,940,828 | 7.7% | 92.3% |
| 2015 | 9,845,333 | 7.7% | 92.3% |
| 2014 | 9,750,405 | 7.6% | 92.4% |
| 2013 | 9,651,380 | 7.6% | 92.4% |
| 2012 | 9,544,249 | 7.5% | 92.5% |
| 2011 | 9,418,736 | 7.4% | 92.6% |
| 2010 | 9,271,178 | 7.4% | 92.6% |
Nativity & Citizenship FAQs for North Carolina
Approximately 9.1% of residents in North Carolina were born outside the United States.
The vast majority of residents, roughly 94.8%, are U.S. citizens (including both native-born and naturalized citizens).