Onslow County, North Carolina Nativity & Citizenship Status (2024)
Place of birth and citizenship status analysis for Onslow County, North Carolina
Onslow County, North Carolina Nativity & Citizenship Indicators (2024)
Native Born
95.8%
Foreign Born
4.2%
Naturalized
2.8%
US Citizens
98.5%
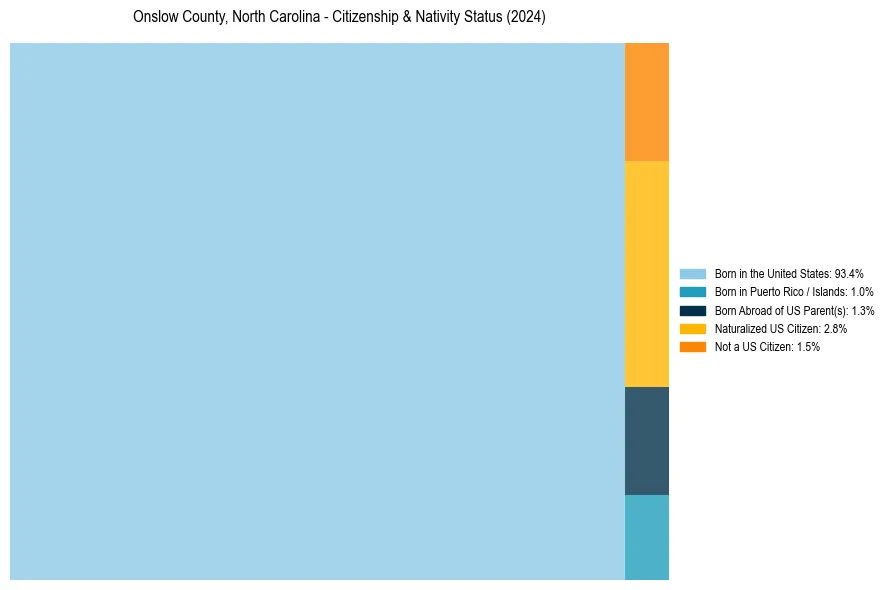
Onslow County, North Carolina Nativity & Citizenship Distribution
Onslow County, North Carolina Historical Nativity Trends (2010–2024)
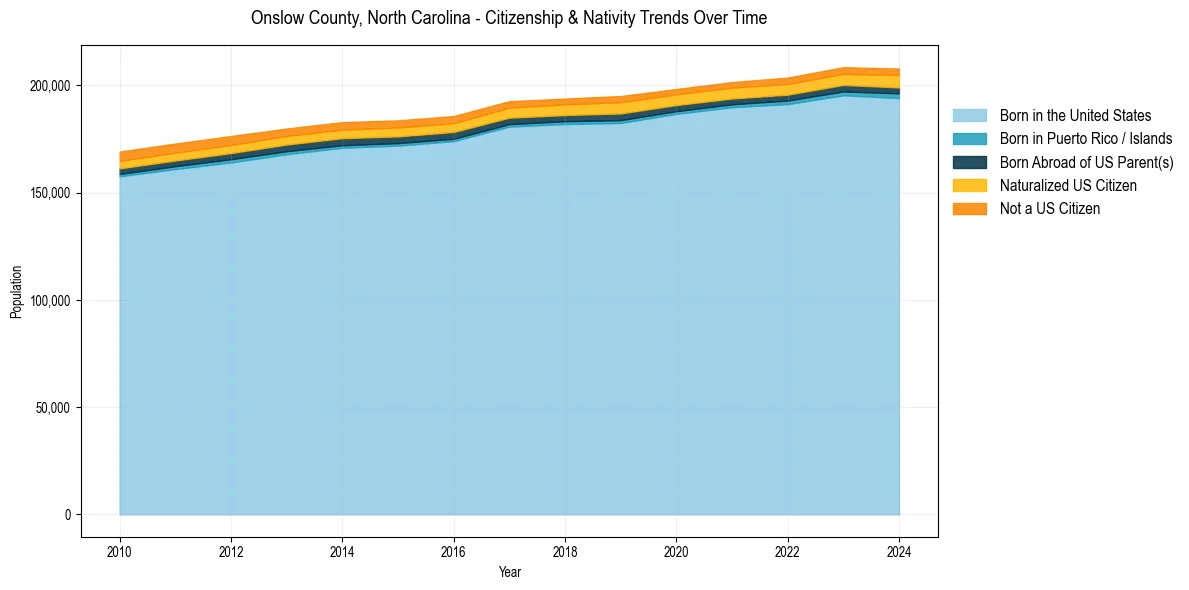
Onslow County, North Carolina Population & Nativity History
| Year | Total Pop | Foreign Born | Native Born |
|---|---|---|---|
| 2024 | 207,906 | 4.2% | 95.8% |
| 2023 | 208,537 | 4.0% | 96.0% |
| 2022 | 203,686 | 3.9% | 96.1% |
| 2021 | 201,597 | 3.8% | 96.2% |
| 2020 | 198,377 | 3.8% | 96.2% |
| 2019 | 195,069 | 4.2% | 95.8% |
| 2018 | 193,912 | 4.0% | 96.0% |
| 2017 | 192,685 | 4.0% | 96.0% |
| 2016 | 185,755 | 4.0% | 96.0% |
| 2015 | 183,753 | 4.1% | 95.9% |
| 2014 | 182,921 | 4.1% | 95.9% |
| 2013 | 179,935 | 4.2% | 95.8% |
| 2012 | 176,461 | 4.5% | 95.5% |
| 2011 | 172,917 | 4.6% | 95.4% |
| 2010 | 169,207 | 4.6% | 95.4% |
Nativity & Citizenship FAQs for Onslow County, North Carolina
Approximately 4.2% of residents in Onslow County, North Carolina were born outside the United States.
The vast majority of residents, roughly 98.5%, are U.S. citizens (including both native-born and naturalized citizens).