Orange County, North Carolina Nativity & Citizenship Status (2024)
Place of birth and citizenship status analysis for Orange County, North Carolina
Orange County, North Carolina Nativity & Citizenship Indicators (2024)
Native Born
87.1%
Foreign Born
12.9%
Naturalized
6.2%
US Citizens
93.3%
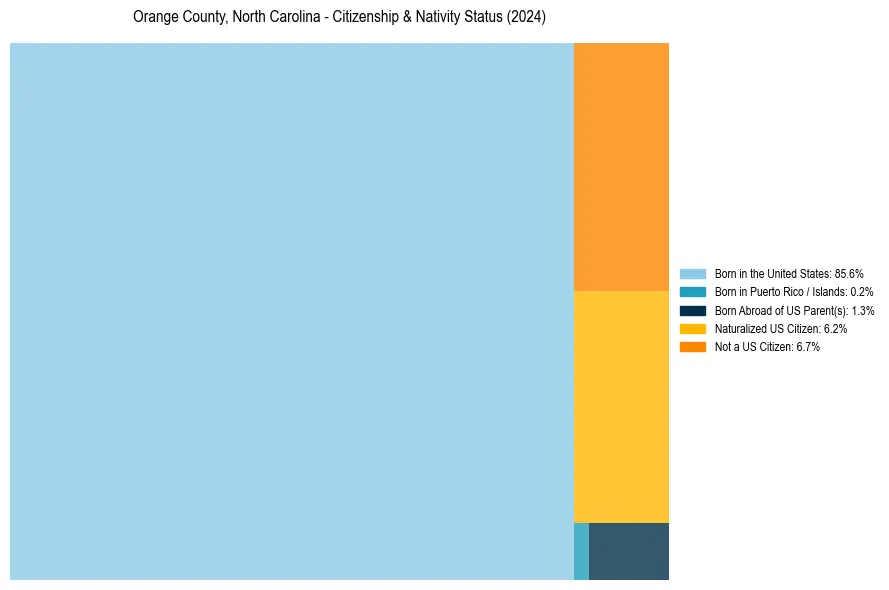
Orange County, North Carolina Nativity & Citizenship Distribution
Orange County, North Carolina Historical Nativity Trends (2010–2024)
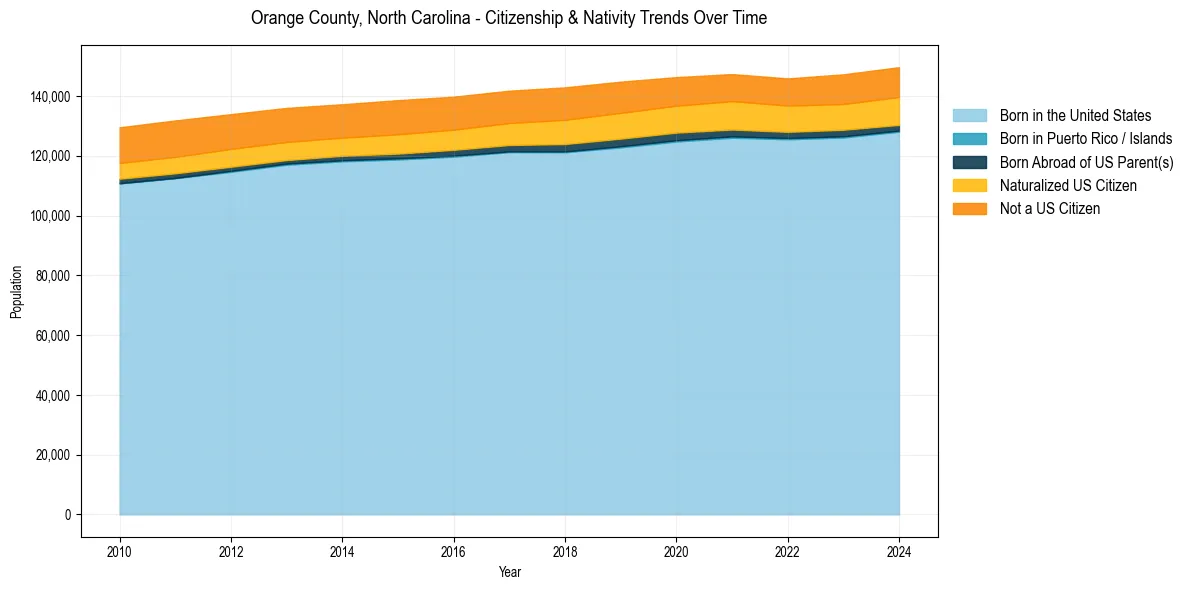
Orange County, North Carolina Population & Nativity History
| Year | Total Pop | Foreign Born | Native Born |
|---|---|---|---|
| 2024 | 149,678 | 12.9% | 87.1% |
| 2023 | 147,292 | 12.6% | 87.4% |
| 2022 | 145,919 | 12.3% | 87.7% |
| 2021 | 147,376 | 12.6% | 87.4% |
| 2020 | 146,354 | 12.7% | 87.3% |
| 2019 | 144,836 | 13.2% | 86.8% |
| 2018 | 142,938 | 13.3% | 86.7% |
| 2017 | 141,812 | 12.8% | 87.2% |
| 2016 | 139,807 | 12.7% | 87.3% |
| 2015 | 138,644 | 12.9% | 87.1% |
| 2014 | 137,275 | 12.6% | 87.4% |
| 2013 | 136,057 | 12.8% | 87.2% |
| 2012 | 133,958 | 13.1% | 86.9% |
| 2011 | 131,856 | 13.4% | 86.6% |
| 2010 | 129,562 | 13.3% | 86.7% |
Nativity & Citizenship FAQs for Orange County, North Carolina
Approximately 12.9% of residents in Orange County, North Carolina were born outside the United States.
The vast majority of residents, roughly 93.3%, are U.S. citizens (including both native-born and naturalized citizens).