Pitt County, North Carolina Nativity & Citizenship Status (2024)
Place of birth and citizenship status analysis for Pitt County, North Carolina
Pitt County, North Carolina Nativity & Citizenship Indicators (2024)
Native Born
94.2%
Foreign Born
5.8%
Naturalized
2.2%
US Citizens
96.4%
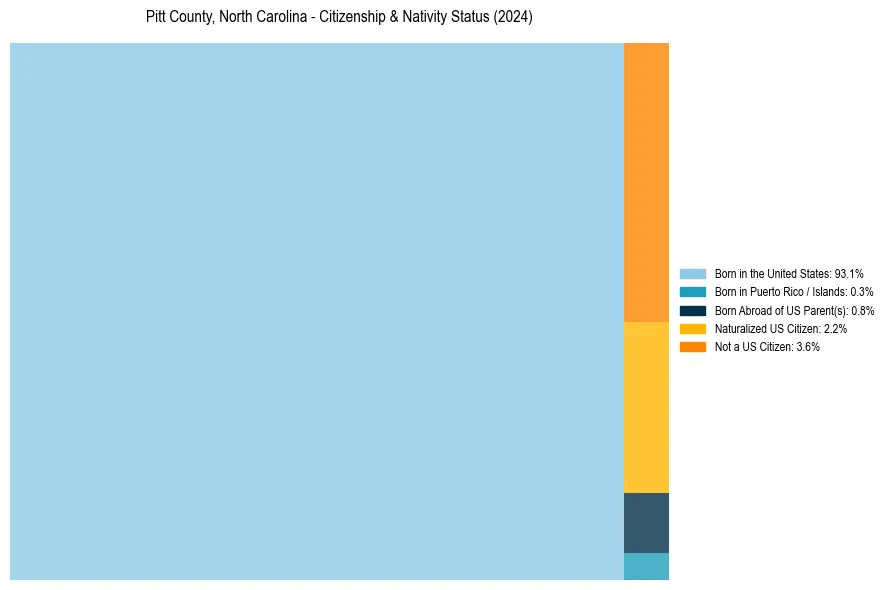
Pitt County, North Carolina Nativity & Citizenship Distribution
Pitt County, North Carolina Historical Nativity Trends (2010–2024)
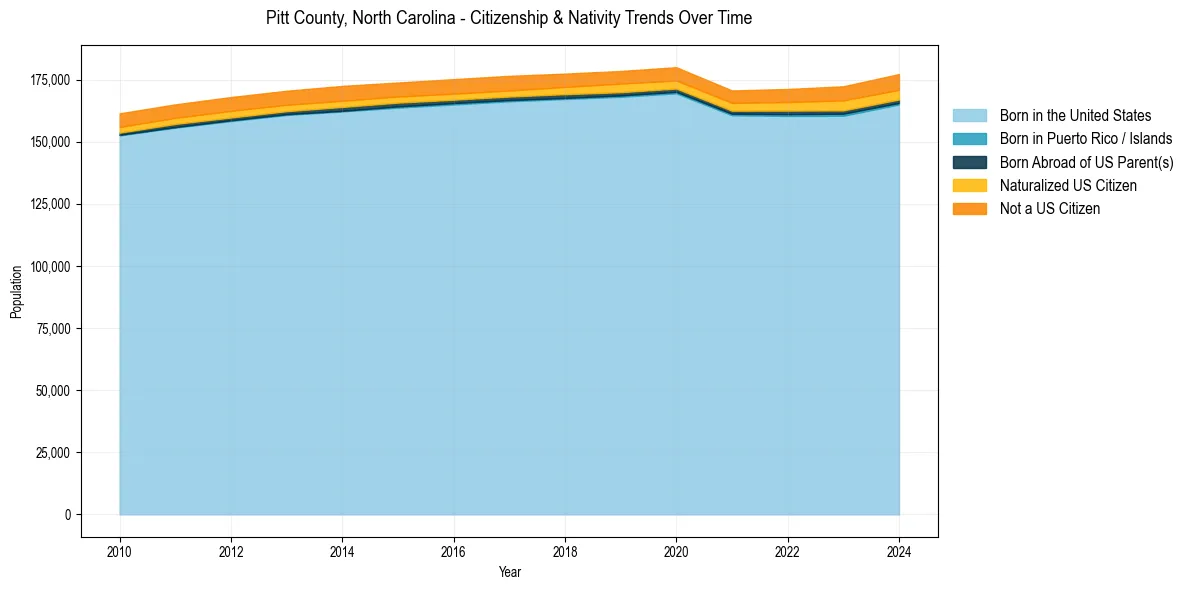
Pitt County, North Carolina Population & Nativity History
| Year | Total Pop | Foreign Born | Native Born |
|---|---|---|---|
| 2024 | 177,193 | 5.8% | 94.2% |
| 2023 | 172,279 | 5.6% | 94.4% |
| 2022 | 171,196 | 5.1% | 94.9% |
| 2021 | 170,600 | 4.8% | 95.2% |
| 2020 | 179,961 | 4.8% | 95.2% |
| 2019 | 178,433 | 4.8% | 95.2% |
| 2018 | 177,372 | 4.7% | 95.3% |
| 2017 | 176,484 | 4.7% | 95.3% |
| 2016 | 175,150 | 4.7% | 95.3% |
| 2015 | 173,798 | 4.7% | 95.3% |
| 2014 | 172,438 | 4.9% | 95.1% |
| 2013 | 170,485 | 4.8% | 95.2% |
| 2012 | 167,951 | 4.9% | 95.1% |
| 2011 | 165,012 | 4.8% | 95.2% |
| 2010 | 161,385 | 4.8% | 95.2% |
Nativity & Citizenship FAQs for Pitt County, North Carolina
Approximately 5.8% of residents in Pitt County, North Carolina were born outside the United States.
The vast majority of residents, roughly 96.4%, are U.S. citizens (including both native-born and naturalized citizens).