Randolph County, North Carolina Nativity & Citizenship Status (2024)
Place of birth and citizenship status analysis for Randolph County, North Carolina
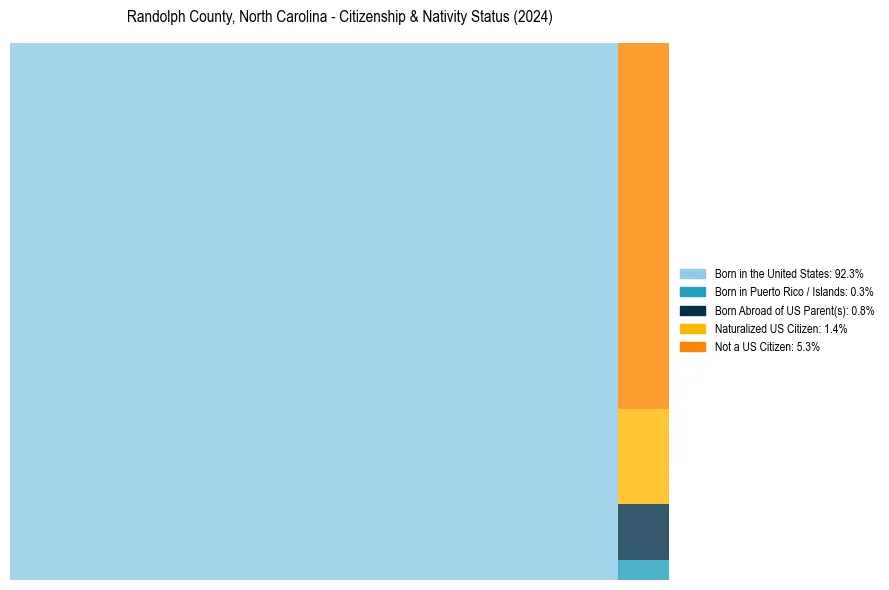
Randolph County, North Carolina Nativity & Citizenship Indicators (2024)
Native Born
93.4%
Foreign Born
6.6%
Naturalized
1.4%
US Citizens
94.7%
Randolph County, North Carolina Nativity & Citizenship Distribution
Randolph County, North Carolina Historical Nativity Trends (2010–2024)
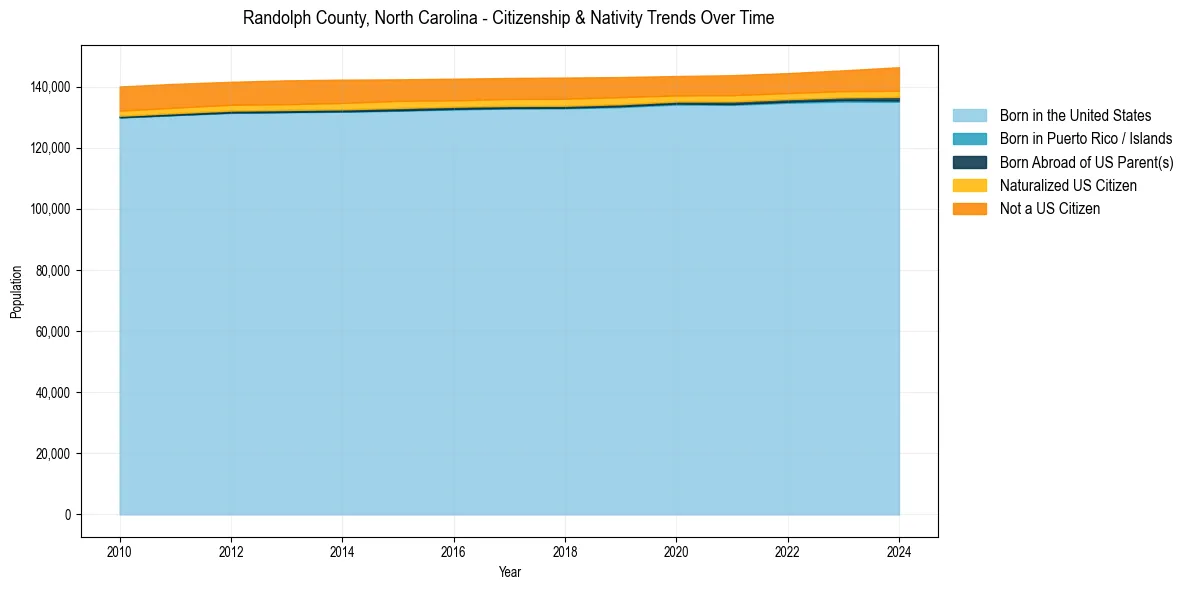
Randolph County, North Carolina Population & Nativity History
| Year | Total Pop | Foreign Born | Native Born |
|---|---|---|---|
| 2024 | 146,348 | 6.6% | 93.4% |
| 2023 | 145,322 | 6.1% | 93.9% |
| 2022 | 144,403 | 5.9% | 94.1% |
| 2021 | 143,735 | 6.0% | 94.0% |
| 2020 | 143,460 | 5.8% | 94.2% |
| 2019 | 143,118 | 6.2% | 93.8% |
| 2018 | 142,958 | 6.5% | 93.5% |
| 2017 | 142,827 | 6.4% | 93.6% |
| 2016 | 142,588 | 6.4% | 93.6% |
| 2015 | 142,370 | 6.6% | 93.4% |
| 2014 | 142,276 | 6.8% | 93.2% |
| 2013 | 142,042 | 6.8% | 93.2% |
| 2012 | 141,568 | 6.6% | 93.4% |
| 2011 | 140,916 | 6.8% | 93.2% |
| 2010 | 140,034 | 6.9% | 93.1% |
Nativity & Citizenship FAQs for Randolph County, North Carolina
Approximately 6.6% of residents in Randolph County, North Carolina were born outside the United States.
The vast majority of residents, roughly 94.7%, are U.S. citizens (including both native-born and naturalized citizens).