Robeson County, North Carolina Nativity & Citizenship Status (2024)
Place of birth and citizenship status analysis for Robeson County, North Carolina
Robeson County, North Carolina Nativity & Citizenship Indicators (2024)
Native Born
94.5%
Foreign Born
5.5%
Naturalized
1.4%
US Citizens
95.8%
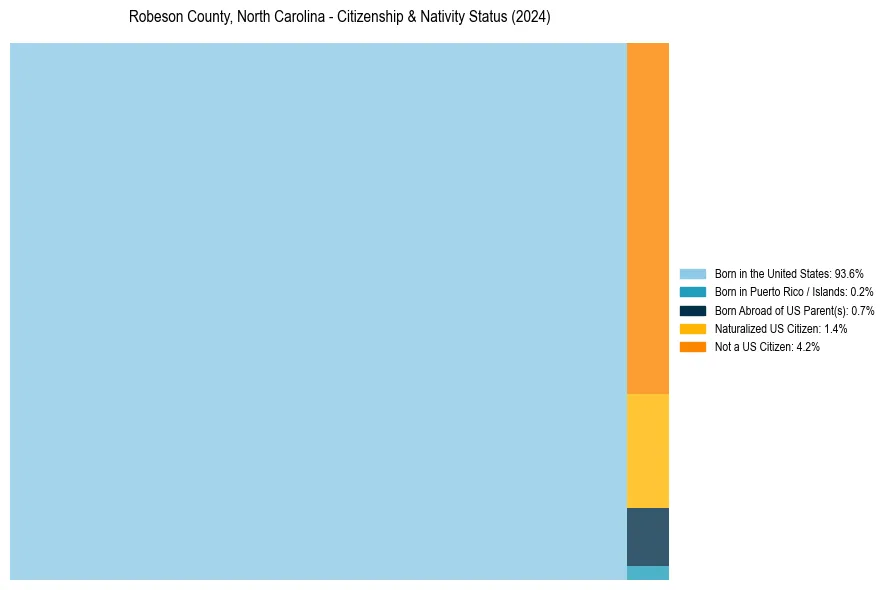
Robeson County, North Carolina Nativity & Citizenship Distribution
Robeson County, North Carolina Historical Nativity Trends (2010–2024)
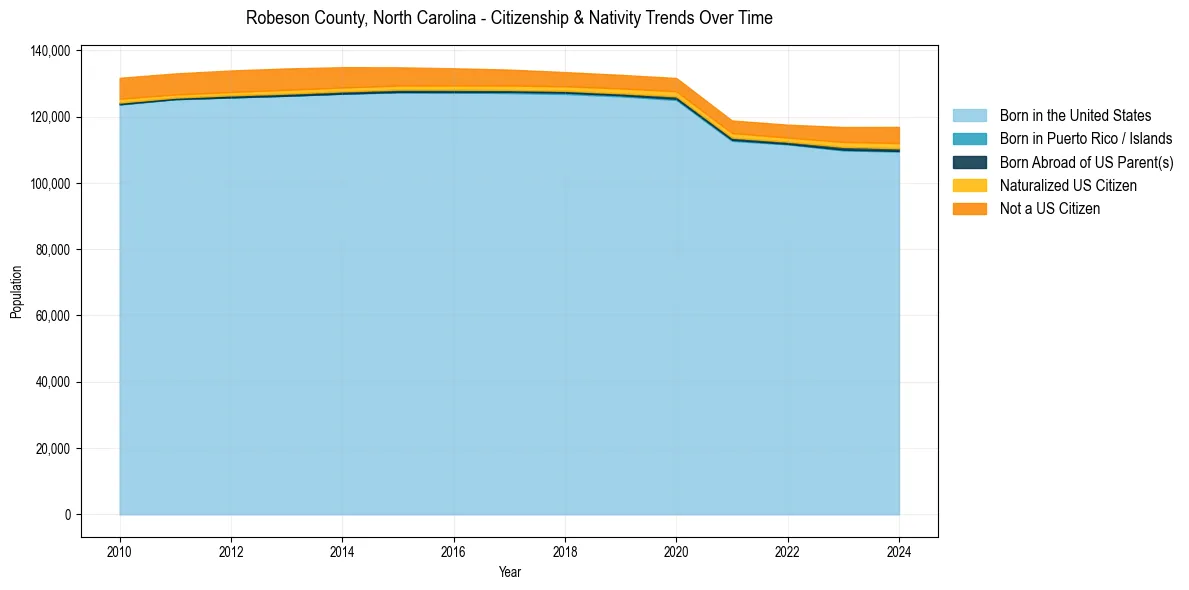
Robeson County, North Carolina Population & Nativity History
| Year | Total Pop | Foreign Born | Native Born |
|---|---|---|---|
| 2024 | 116,902 | 5.5% | 94.5% |
| 2023 | 116,858 | 5.1% | 94.9% |
| 2022 | 117,573 | 4.4% | 95.6% |
| 2021 | 118,836 | 4.4% | 95.6% |
| 2020 | 131,656 | 4.2% | 95.8% |
| 2019 | 132,596 | 4.2% | 95.8% |
| 2018 | 133,442 | 4.2% | 95.8% |
| 2017 | 134,187 | 4.6% | 95.4% |
| 2016 | 134,576 | 4.8% | 95.2% |
| 2015 | 134,871 | 5.0% | 95.0% |
| 2014 | 134,913 | 5.4% | 94.6% |
| 2013 | 134,535 | 5.6% | 94.4% |
| 2012 | 133,920 | 5.6% | 94.4% |
| 2011 | 133,033 | 5.5% | 94.5% |
| 2010 | 131,708 | 5.7% | 94.3% |
Nativity & Citizenship FAQs for Robeson County, North Carolina
Approximately 5.5% of residents in Robeson County, North Carolina were born outside the United States.
The vast majority of residents, roughly 95.8%, are U.S. citizens (including both native-born and naturalized citizens).