Rowan County, North Carolina Nativity & Citizenship Status (2024)
Place of birth and citizenship status analysis for Rowan County, North Carolina
Rowan County, North Carolina Nativity & Citizenship Indicators (2024)
Native Born
93.7%
Foreign Born
6.3%
Naturalized
1.9%
US Citizens
95.6%
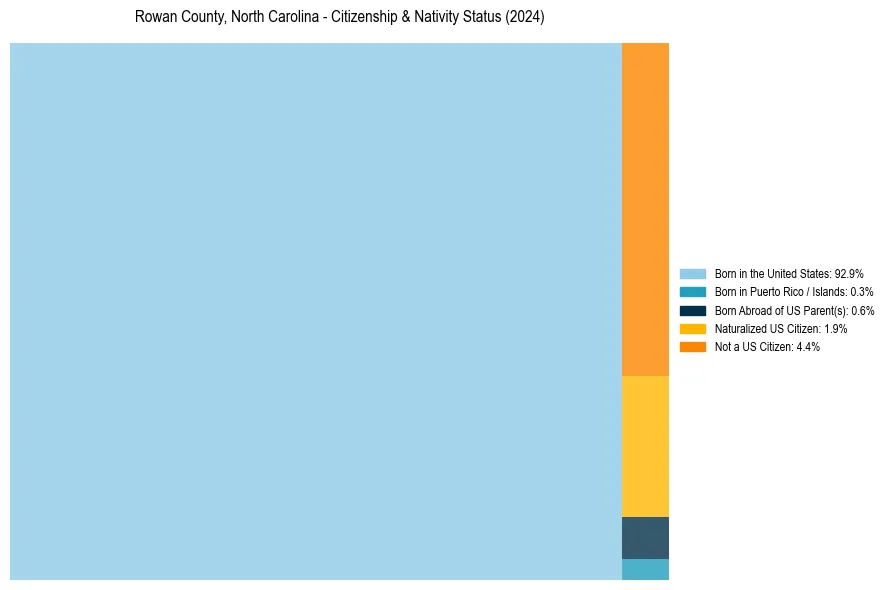
Rowan County, North Carolina Nativity & Citizenship Distribution
Rowan County, North Carolina Historical Nativity Trends (2010–2024)
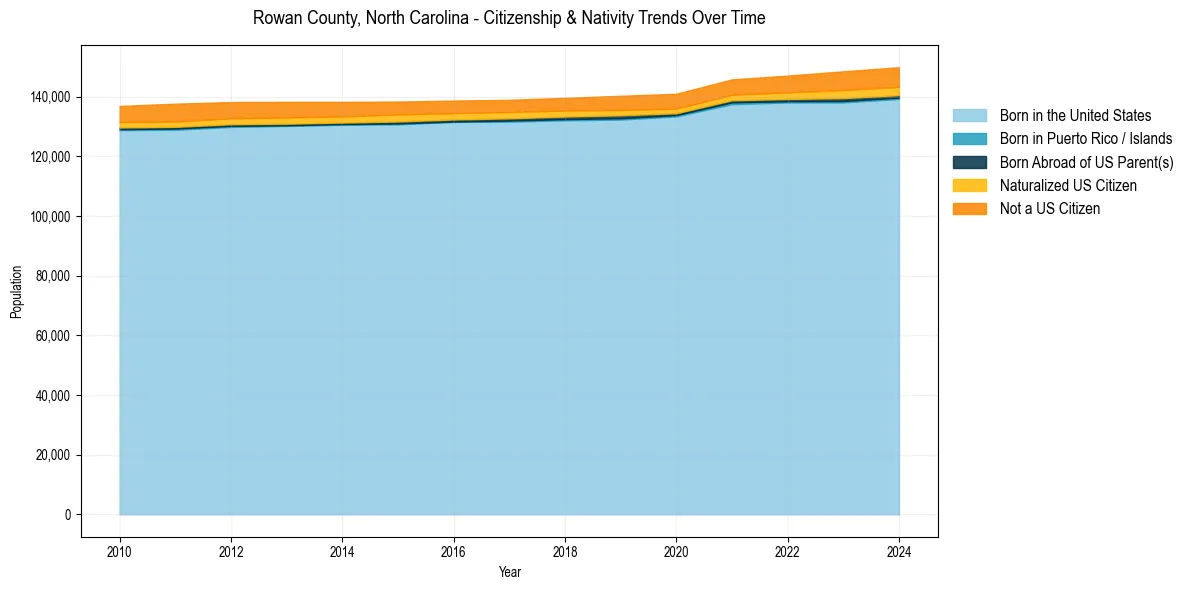
Rowan County, North Carolina Population & Nativity History
| Year | Total Pop | Foreign Born | Native Born |
|---|---|---|---|
| 2024 | 149,875 | 6.3% | 93.7% |
| 2023 | 148,487 | 6.0% | 94.0% |
| 2022 | 147,067 | 5.3% | 94.7% |
| 2021 | 145,784 | 4.8% | 95.2% |
| 2020 | 140,978 | 4.6% | 95.4% |
| 2019 | 140,296 | 4.7% | 95.3% |
| 2018 | 139,605 | 4.5% | 95.5% |
| 2017 | 138,940 | 4.5% | 95.5% |
| 2016 | 138,694 | 4.6% | 95.4% |
| 2015 | 138,361 | 4.8% | 95.2% |
| 2014 | 138,246 | 5.0% | 95.0% |
| 2013 | 138,265 | 5.3% | 94.7% |
| 2012 | 138,189 | 5.4% | 94.6% |
| 2011 | 137,654 | 5.6% | 94.4% |
| 2010 | 136,880 | 5.3% | 94.7% |
Nativity & Citizenship FAQs for Rowan County, North Carolina
Approximately 6.3% of residents in Rowan County, North Carolina were born outside the United States.
The vast majority of residents, roughly 95.6%, are U.S. citizens (including both native-born and naturalized citizens).