Ohio Age & Gender Distribution (2024)
Population distribution by age and gender for Ohio
Ohio Age & Gender Statistics (2024)
Total Population
11,810,293
Median Age
39.7
Male Median
38.4
Female Median
40.9
Ohio Population Growth
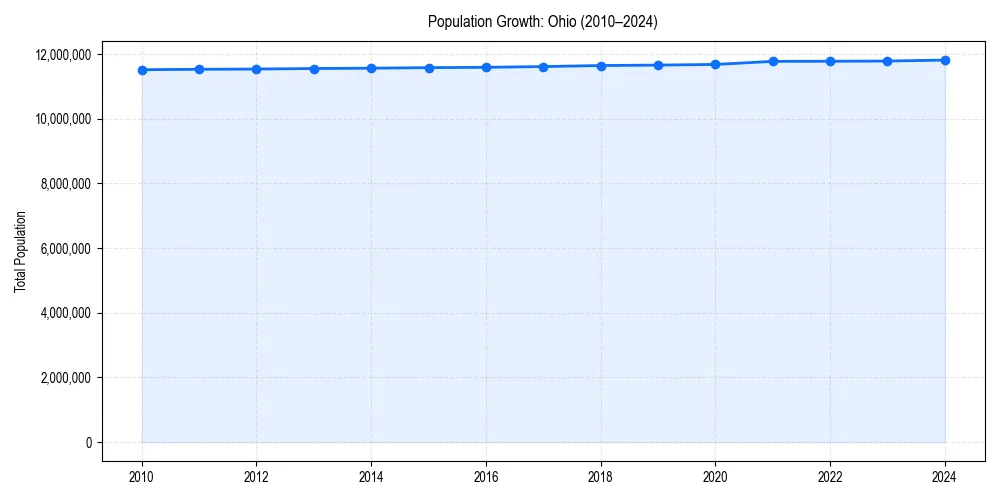
Ohio Demographic Trend
Since 2010, the population of has changed by +2.6%%.
+2.6%% Growth
Ohio Age & Gender Pyramid
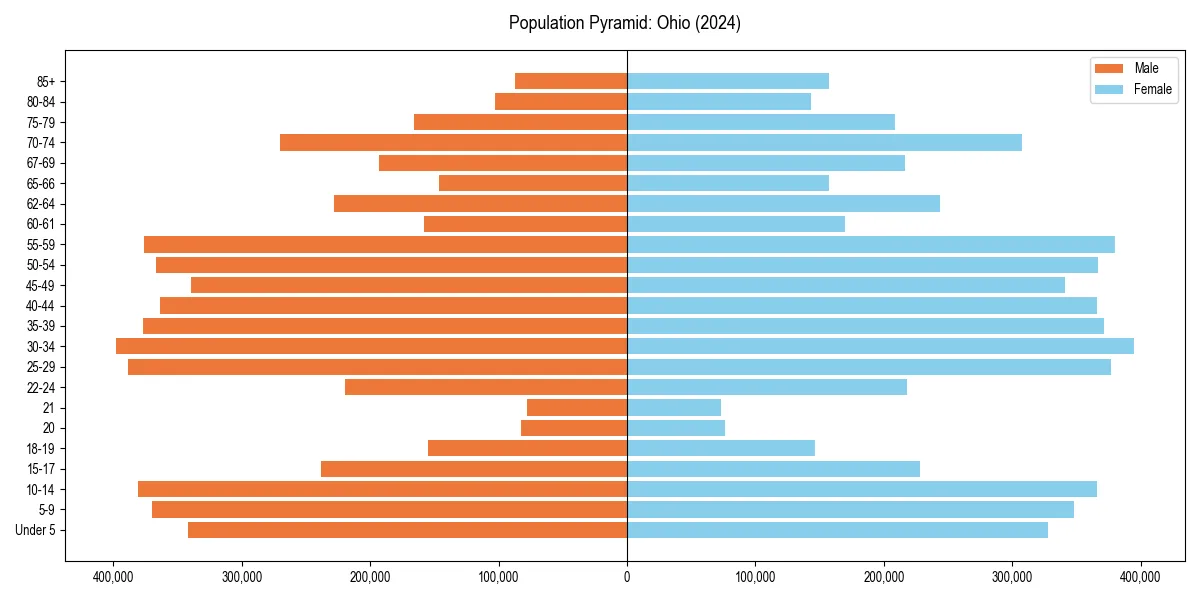
Figure 2: Population distribution by age and gender for 2024.
Ohio Historical Population Data
| Year | Median Age | Population |
|---|---|---|
| 2024 | 39.7 | 11,810,293 |
| 2023 | 39.6 | 11,780,046 |
| 2022 | 39.6 | 11,774,683 |
| 2021 | 39.4 | 11,769,923 |
| 2020 | 39.5 | 11,675,275 |
| 2019 | 39.4 | 11,655,397 |
| 2018 | 39.3 | 11,641,879 |
| 2017 | 39.3 | 11,609,756 |
| 2016 | 39.3 | 11,586,941 |
| 2015 | 39.2 | 11,575,977 |
| 2014 | 39.1 | 11,560,380 |
| 2013 | 39.0 | 11,549,590 |
| 2012 | 38.8 | 11,533,561 |
| 2011 | 38.5 | 11,525,536 |
| 2010 | 38.3 | 11,512,431 |
Ohio Age Group Breakdown (2024)
| Age Cohort | Percentage |
|---|---|
| Under 5 | 5.7% |
| 5–17 | 16.3% |
| 18–24 | 8.9% |
| 25–34 | 13.2% |
| 35–54 | 24.5% |
| 55–64 | 13.2% |
| 65+ | 18.3% |
Dependency Ratios for Ohio
- Total Dependency Ratio:
- 67.4
- Youth Dependency:
- 36.9
- Old-Age Dependency:
- 30.6
The dependency ratio measures dependents (ages 0-17 and 65+) per 100 working-age individuals (ages 18-64).
Age & Gender FAQs for Ohio
The median age in Ohio is 39.7 years.
According to latest Census data, the total population of Ohio is 11,810,293.
In Ohio, seniors (ages 65+) make up 18.3% of the population, while children under 18 represent 16.3%.
Based on historical data since 2010, the population in Ohio has remained stable.