Butler County, Ohio Nativity & Citizenship Status (2024)
Place of birth and citizenship status analysis for Butler County, Ohio
Butler County, Ohio Nativity & Citizenship Indicators (2024)
Native Born
92.0%
Foreign Born
8.0%
Naturalized
3.8%
US Citizens
95.7%
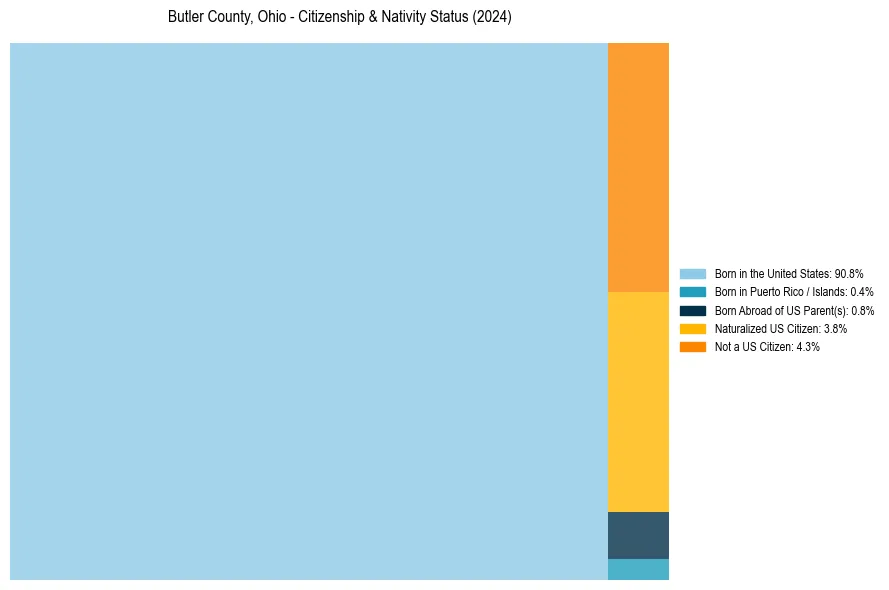
Butler County, Ohio Nativity & Citizenship Distribution
Butler County, Ohio Historical Nativity Trends (2010–2024)
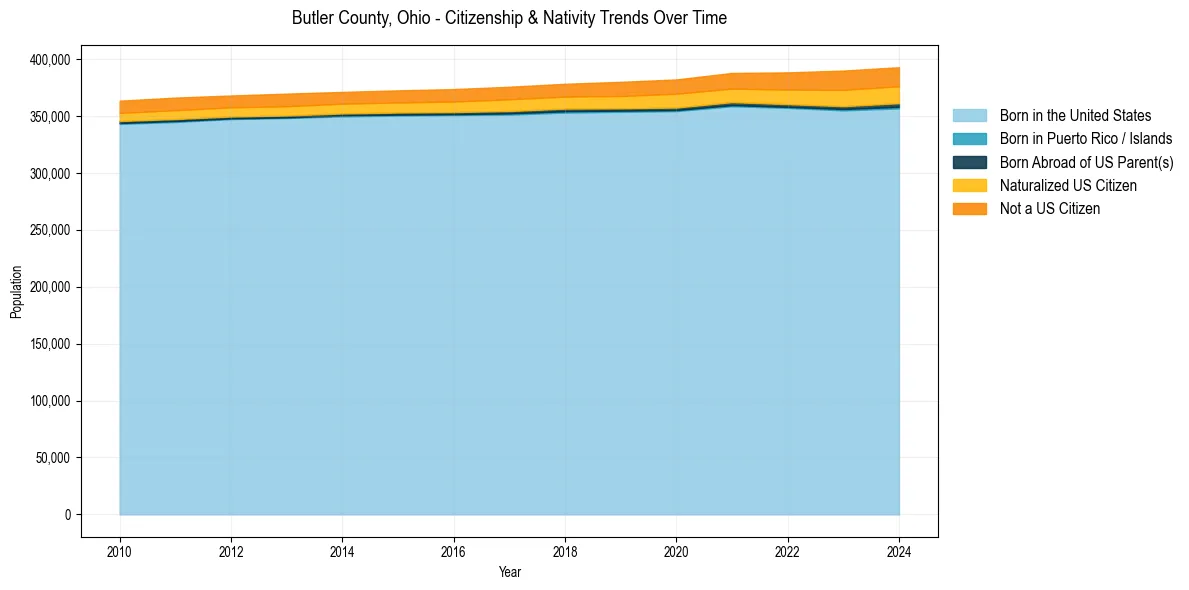
Butler County, Ohio Population & Nativity History
| Year | Total Pop | Foreign Born | Native Born |
|---|---|---|---|
| 2024 | 392,876 | 8.0% | 92.0% |
| 2023 | 389,910 | 8.0% | 92.0% |
| 2022 | 388,327 | 7.2% | 92.8% |
| 2021 | 387,830 | 6.6% | 93.4% |
| 2020 | 382,129 | 6.5% | 93.5% |
| 2019 | 380,019 | 6.1% | 93.9% |
| 2018 | 378,294 | 5.8% | 94.2% |
| 2017 | 375,702 | 5.7% | 94.3% |
| 2016 | 373,638 | 5.4% | 94.6% |
| 2015 | 372,538 | 5.2% | 94.8% |
| 2014 | 371,154 | 5.1% | 94.9% |
| 2013 | 369,650 | 5.2% | 94.8% |
| 2012 | 368,029 | 5.0% | 95.0% |
| 2011 | 366,167 | 5.1% | 94.9% |
| 2010 | 363,465 | 4.9% | 95.1% |
Nativity & Citizenship FAQs for Butler County, Ohio
Approximately 8.0% of residents in Butler County, Ohio were born outside the United States.
The vast majority of residents, roughly 95.7%, are U.S. citizens (including both native-born and naturalized citizens).