Clermont County, Ohio Nativity & Citizenship Status (2024)
Place of birth and citizenship status analysis for Clermont County, Ohio
Clermont County, Ohio Nativity & Citizenship Indicators (2024)
Native Born
97.7%
Foreign Born
2.3%
Naturalized
1.2%
US Citizens
98.9%
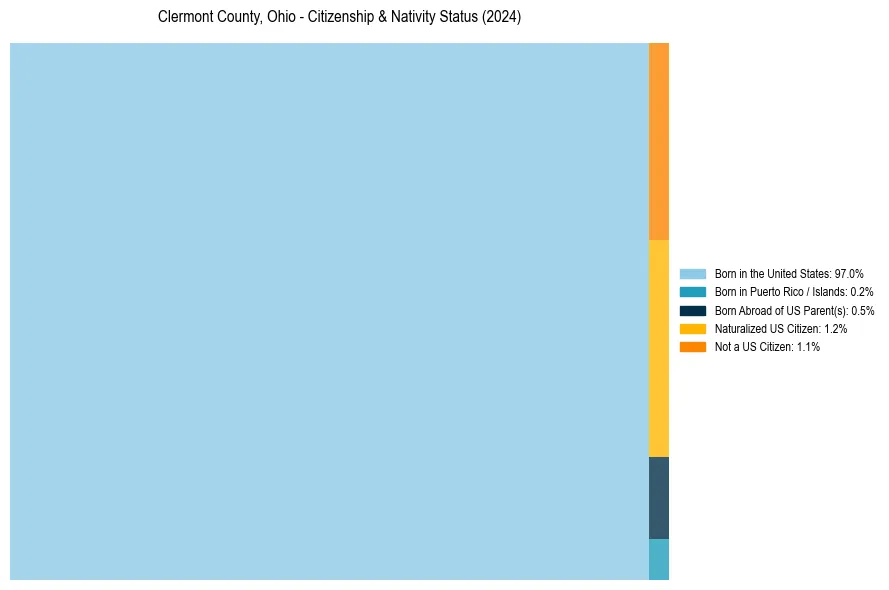
Clermont County, Ohio Nativity & Citizenship Distribution
Clermont County, Ohio Historical Nativity Trends (2010–2024)
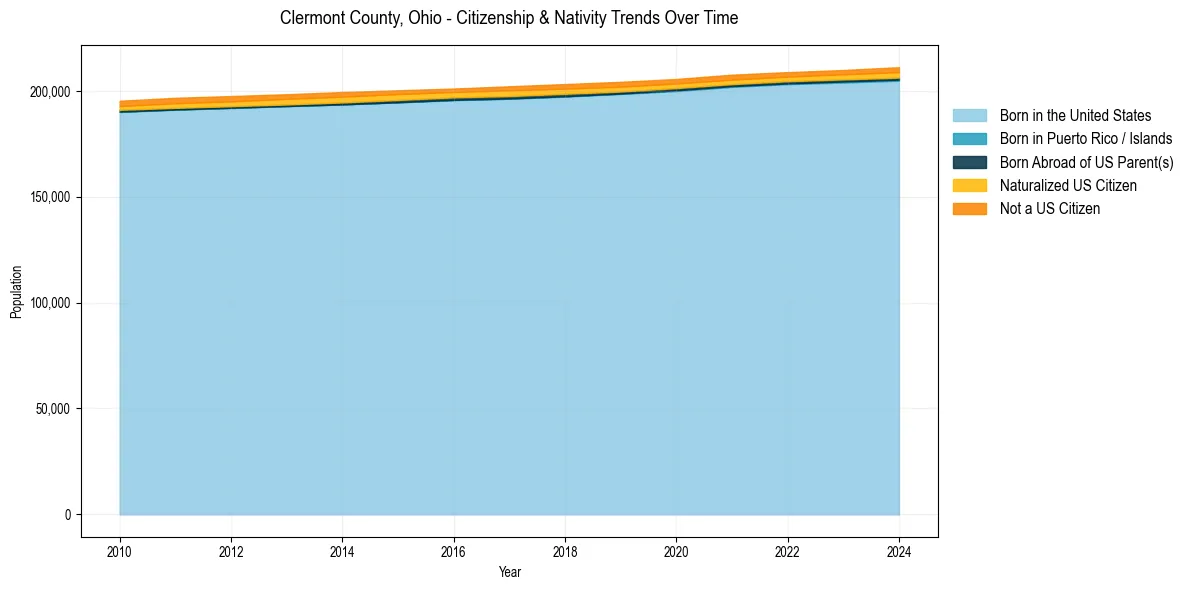
Clermont County, Ohio Population & Nativity History
| Year | Total Pop | Foreign Born | Native Born |
|---|---|---|---|
| 2024 | 211,181 | 2.3% | 97.7% |
| 2023 | 209,862 | 2.1% | 97.9% |
| 2022 | 208,851 | 2.0% | 98.0% |
| 2021 | 207,650 | 2.2% | 97.8% |
| 2020 | 205,616 | 2.1% | 97.9% |
| 2019 | 204,275 | 2.2% | 97.8% |
| 2018 | 203,216 | 2.3% | 97.7% |
| 2017 | 202,166 | 2.3% | 97.7% |
| 2016 | 201,092 | 2.1% | 97.9% |
| 2015 | 200,285 | 2.3% | 97.7% |
| 2014 | 199,450 | 2.5% | 97.5% |
| 2013 | 198,417 | 2.4% | 97.6% |
| 2012 | 197,543 | 2.4% | 97.6% |
| 2011 | 196,731 | 2.4% | 97.6% |
| 2010 | 195,312 | 2.2% | 97.8% |
Nativity & Citizenship FAQs for Clermont County, Ohio
Approximately 2.3% of residents in Clermont County, Ohio were born outside the United States.
The vast majority of residents, roughly 98.9%, are U.S. citizens (including both native-born and naturalized citizens).