Delaware County, Ohio Nativity & Citizenship Status (2024)
Place of birth and citizenship status analysis for Delaware County, Ohio
Delaware County, Ohio Nativity & Citizenship Indicators (2024)
Native Born
90.3%
Foreign Born
9.7%
Naturalized
4.9%
US Citizens
95.1%
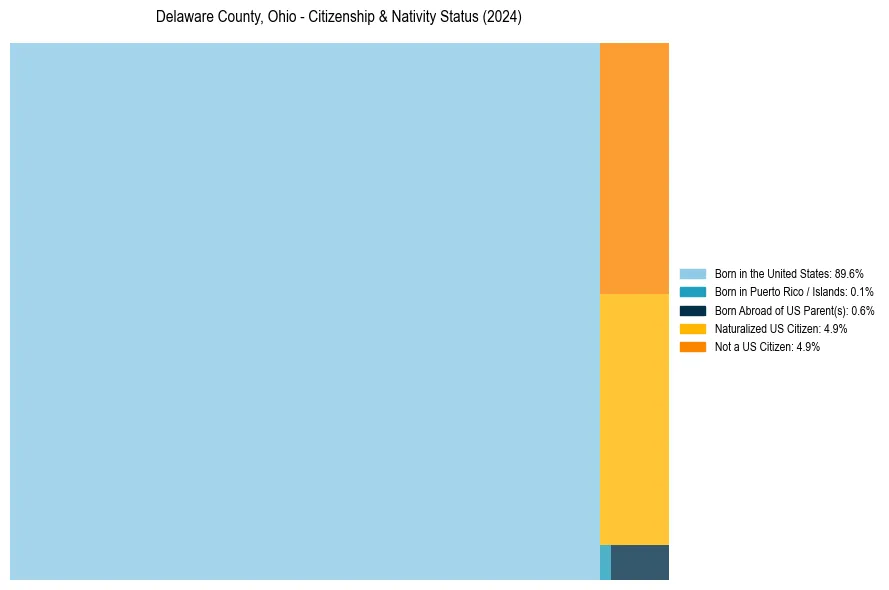
Delaware County, Ohio Nativity & Citizenship Distribution
Delaware County, Ohio Historical Nativity Trends (2010–2024)
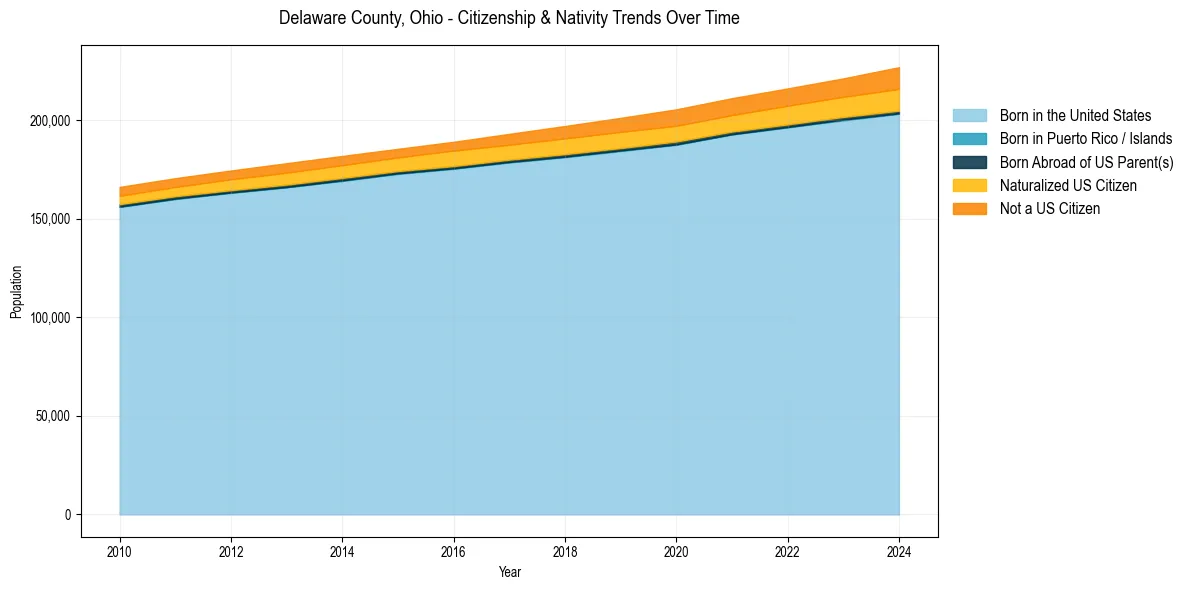
Delaware County, Ohio Population & Nativity History
| Year | Total Pop | Foreign Born | Native Born |
|---|---|---|---|
| 2024 | 226,834 | 9.7% | 90.3% |
| 2023 | 221,160 | 8.9% | 91.1% |
| 2022 | 216,074 | 8.5% | 91.5% |
| 2021 | 211,121 | 8.0% | 92.0% |
| 2020 | 205,454 | 7.9% | 92.1% |
| 2019 | 201,135 | 7.6% | 92.4% |
| 2018 | 197,008 | 7.3% | 92.7% |
| 2017 | 193,024 | 6.8% | 93.2% |
| 2016 | 188,996 | 6.5% | 93.5% |
| 2015 | 185,433 | 6.1% | 93.9% |
| 2014 | 181,821 | 6.1% | 93.9% |
| 2013 | 178,139 | 6.1% | 93.9% |
| 2012 | 174,454 | 5.7% | 94.3% |
| 2011 | 170,541 | 5.4% | 94.6% |
| 2010 | 166,108 | 5.3% | 94.7% |
Nativity & Citizenship FAQs for Delaware County, Ohio
Approximately 9.7% of residents in Delaware County, Ohio were born outside the United States.
The vast majority of residents, roughly 95.1%, are U.S. citizens (including both native-born and naturalized citizens).