Greene County, Ohio Nativity & Citizenship Status (2024)
Place of birth and citizenship status analysis for Greene County, Ohio
Greene County, Ohio Nativity & Citizenship Indicators (2024)
Native Born
95.3%
Foreign Born
4.7%
Naturalized
2.9%
US Citizens
98.2%
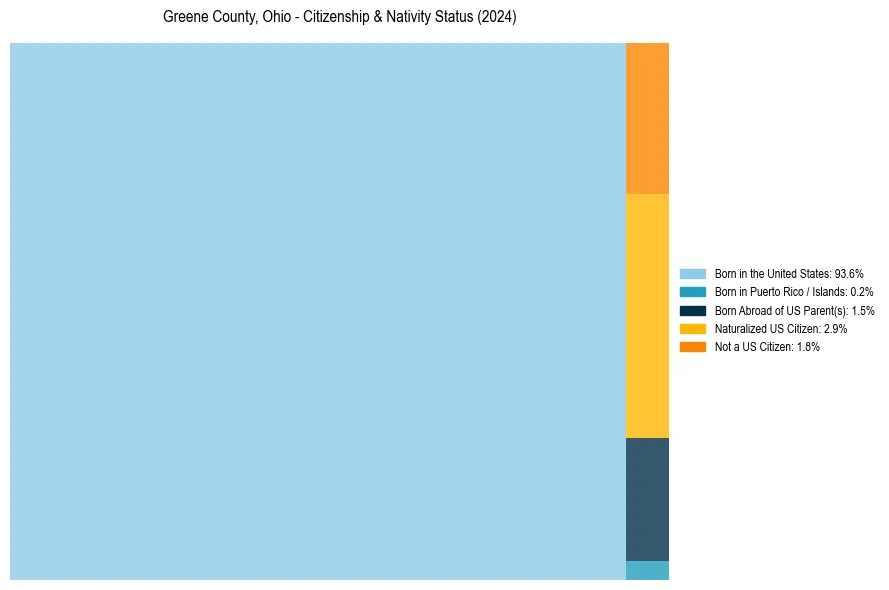
Greene County, Ohio Nativity & Citizenship Distribution
Greene County, Ohio Historical Nativity Trends (2010–2024)
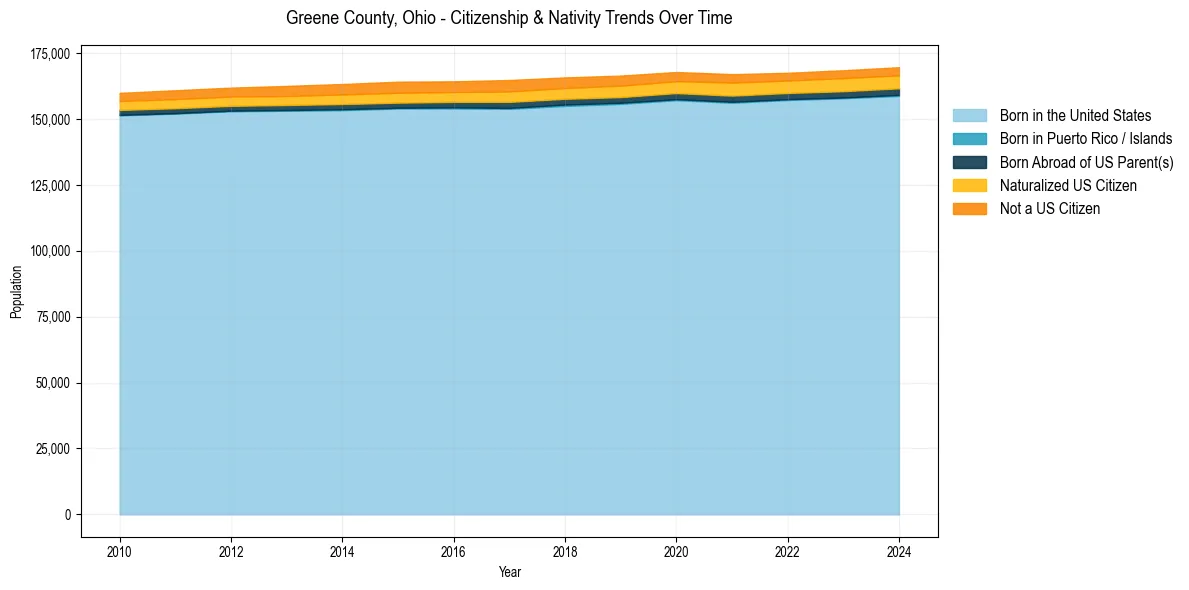
Greene County, Ohio Population & Nativity History
| Year | Total Pop | Foreign Born | Native Born |
|---|---|---|---|
| 2024 | 169,688 | 4.7% | 95.3% |
| 2023 | 168,531 | 4.7% | 95.3% |
| 2022 | 167,567 | 4.6% | 95.4% |
| 2021 | 167,043 | 4.9% | 95.1% |
| 2020 | 167,867 | 4.8% | 95.2% |
| 2019 | 166,502 | 4.9% | 95.1% |
| 2018 | 165,811 | 4.9% | 95.1% |
| 2017 | 164,825 | 5.0% | 95.0% |
| 2016 | 164,325 | 4.7% | 95.3% |
| 2015 | 164,192 | 4.9% | 95.1% |
| 2014 | 163,313 | 4.7% | 95.3% |
| 2013 | 162,588 | 4.5% | 95.5% |
| 2012 | 161,936 | 4.3% | 95.7% |
| 2011 | 160,940 | 4.2% | 95.8% |
| 2010 | 159,940 | 4.1% | 95.9% |
Nativity & Citizenship FAQs for Greene County, Ohio
Approximately 4.7% of residents in Greene County, Ohio were born outside the United States.
The vast majority of residents, roughly 98.2%, are U.S. citizens (including both native-born and naturalized citizens).