Hamilton County, Ohio Nativity & Citizenship Status (2024)
Place of birth and citizenship status analysis for Hamilton County, Ohio
Hamilton County, Ohio Nativity & Citizenship Indicators (2024)
Native Born
93.7%
Foreign Born
6.3%
Naturalized
2.8%
US Citizens
96.5%
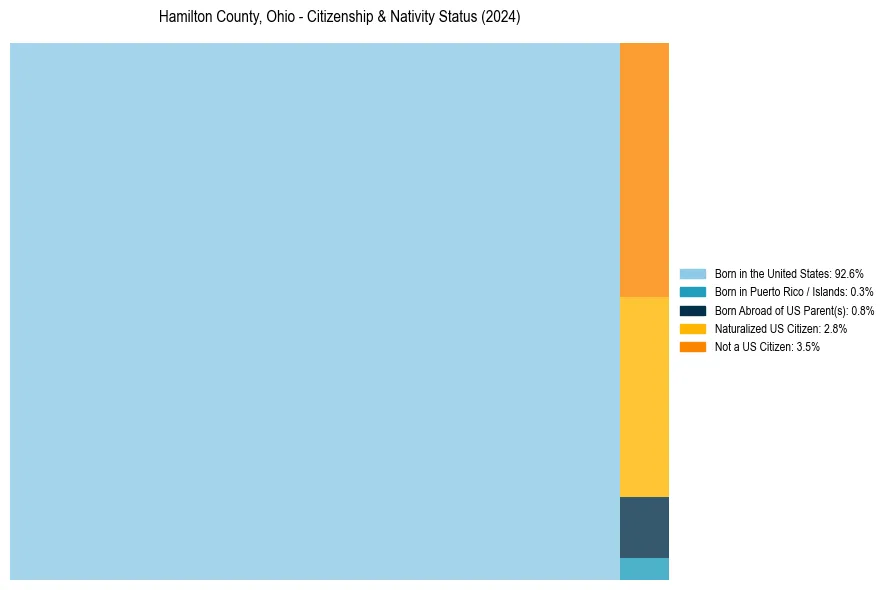
Hamilton County, Ohio Nativity & Citizenship Distribution
Hamilton County, Ohio Historical Nativity Trends (2010–2024)
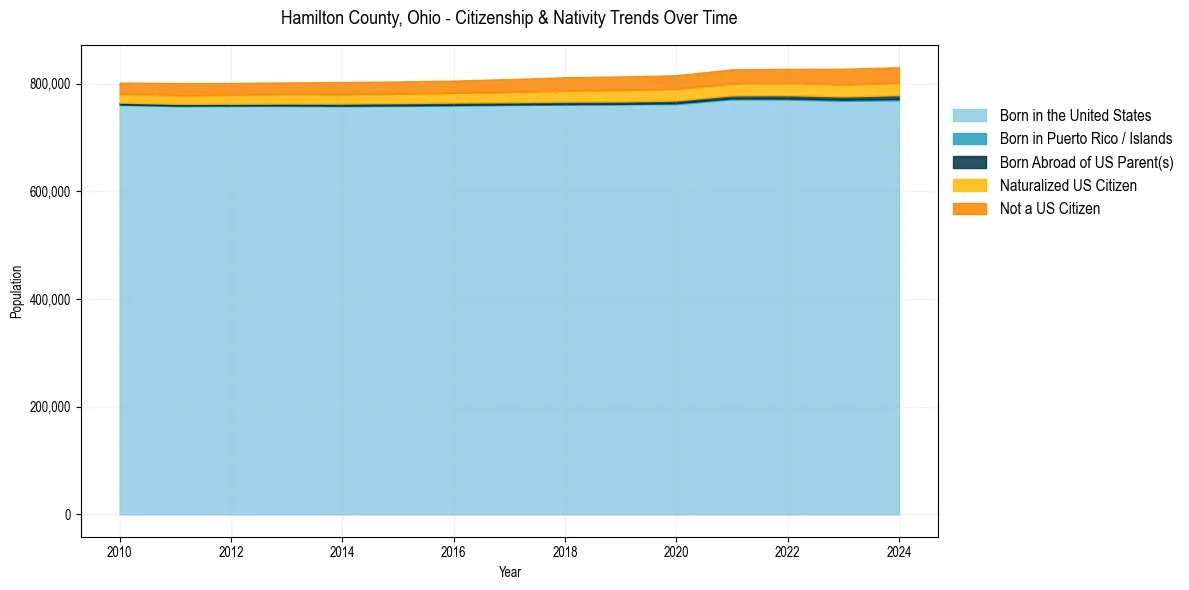
Hamilton County, Ohio Population & Nativity History
| Year | Total Pop | Foreign Born | Native Born |
|---|---|---|---|
| 2024 | 830,774 | 6.3% | 93.7% |
| 2023 | 827,878 | 6.2% | 93.8% |
| 2022 | 827,671 | 5.9% | 94.1% |
| 2021 | 826,790 | 5.9% | 94.1% |
| 2020 | 815,790 | 5.8% | 94.2% |
| 2019 | 813,589 | 5.7% | 94.3% |
| 2018 | 812,037 | 5.6% | 94.4% |
| 2017 | 808,703 | 5.3% | 94.7% |
| 2016 | 805,965 | 5.1% | 94.9% |
| 2015 | 804,194 | 5.0% | 95.0% |
| 2014 | 803,272 | 5.0% | 95.0% |
| 2013 | 802,481 | 4.9% | 95.1% |
| 2012 | 801,350 | 4.8% | 95.2% |
| 2011 | 801,223 | 4.8% | 95.2% |
| 2010 | 802,194 | 4.6% | 95.4% |
Nativity & Citizenship FAQs for Hamilton County, Ohio
Approximately 6.3% of residents in Hamilton County, Ohio were born outside the United States.
The vast majority of residents, roughly 96.5%, are U.S. citizens (including both native-born and naturalized citizens).