Hancock County, Ohio Nativity & Citizenship Status (2024)
Place of birth and citizenship status analysis for Hancock County, Ohio
Hancock County, Ohio Nativity & Citizenship Indicators (2024)
Native Born
96.7%
Foreign Born
3.3%
Naturalized
1.3%
US Citizens
97.9%
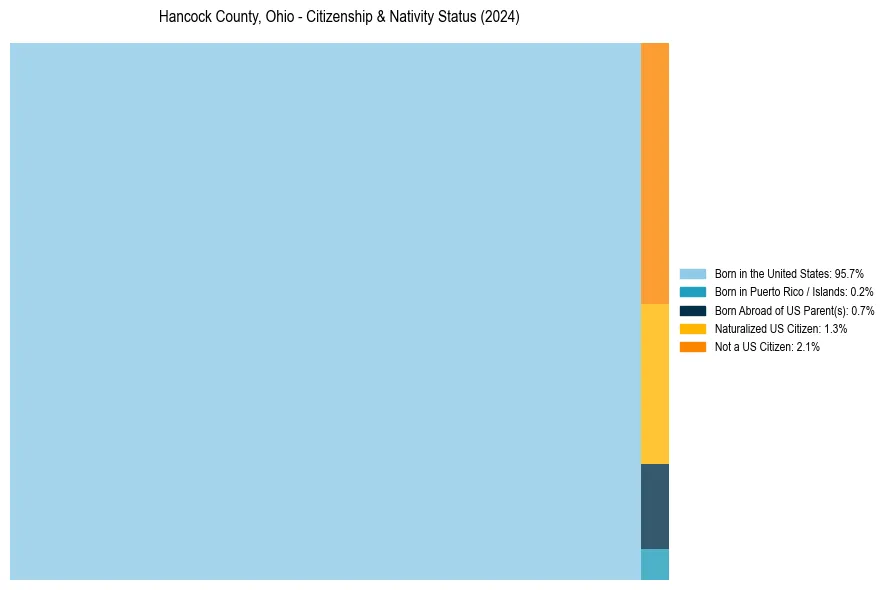
Hancock County, Ohio Nativity & Citizenship Distribution
Hancock County, Ohio Historical Nativity Trends (2010–2024)
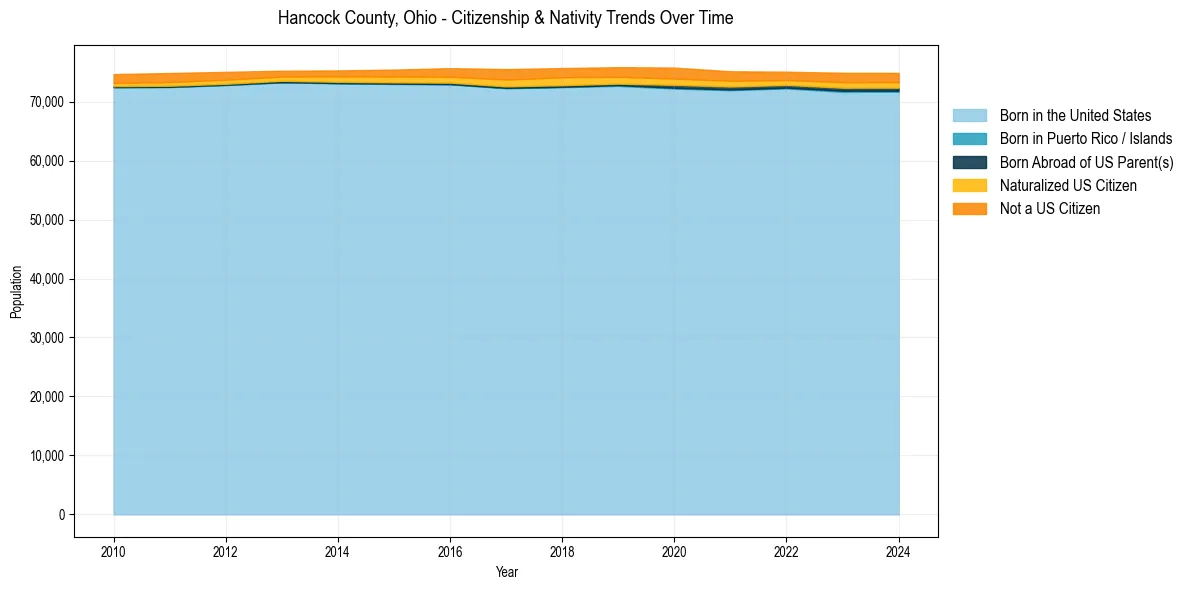
Hancock County, Ohio Population & Nativity History
| Year | Total Pop | Foreign Born | Native Born |
|---|---|---|---|
| 2024 | 74,866 | 3.3% | 96.7% |
| 2023 | 74,885 | 3.4% | 96.6% |
| 2022 | 75,072 | 3.0% | 97.0% |
| 2021 | 75,139 | 3.4% | 96.6% |
| 2020 | 75,765 | 3.9% | 96.1% |
| 2019 | 75,837 | 3.7% | 96.3% |
| 2018 | 75,690 | 3.8% | 96.2% |
| 2017 | 75,508 | 3.9% | 96.1% |
| 2016 | 75,672 | 3.3% | 96.7% |
| 2015 | 75,428 | 2.9% | 97.1% |
| 2014 | 75,290 | 2.6% | 97.4% |
| 2013 | 75,239 | 2.3% | 97.7% |
| 2012 | 75,043 | 2.7% | 97.3% |
| 2011 | 74,847 | 2.9% | 97.1% |
| 2010 | 74,670 | 2.7% | 97.3% |
Nativity & Citizenship FAQs for Hancock County, Ohio
Approximately 3.3% of residents in Hancock County, Ohio were born outside the United States.
The vast majority of residents, roughly 97.9%, are U.S. citizens (including both native-born and naturalized citizens).