Mahoning County, Ohio Nativity & Citizenship Status (2024)
Place of birth and citizenship status analysis for Mahoning County, Ohio
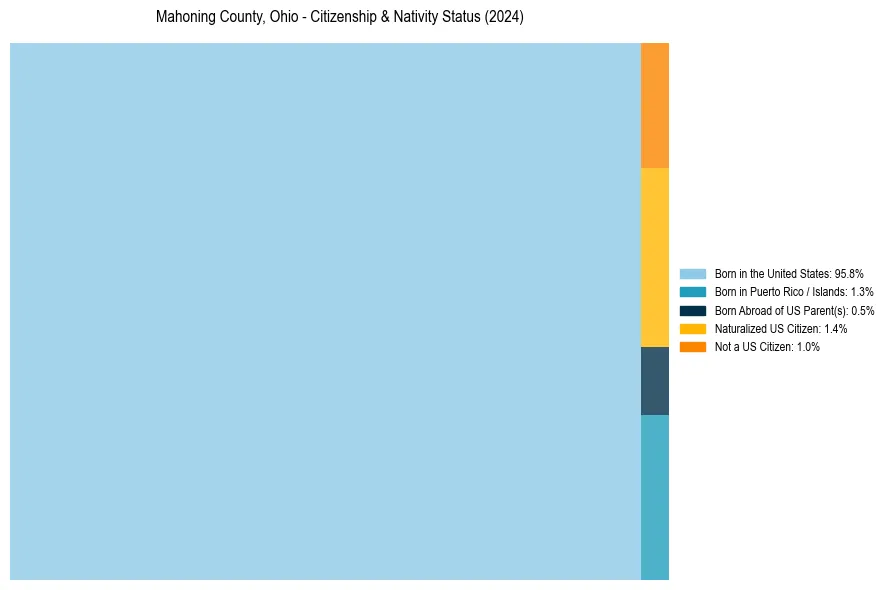
Mahoning County, Ohio Nativity & Citizenship Indicators (2024)
Native Born
97.6%
Foreign Born
2.4%
Naturalized
1.4%
US Citizens
99.0%
Mahoning County, Ohio Nativity & Citizenship Distribution
Mahoning County, Ohio Historical Nativity Trends (2010–2024)
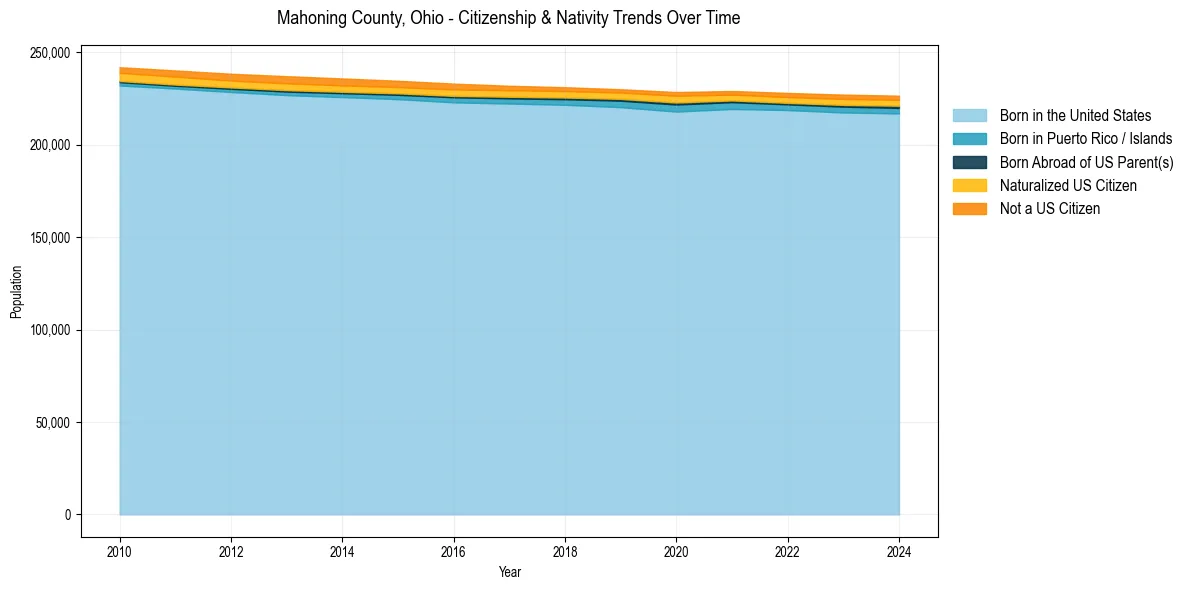
Mahoning County, Ohio Population & Nativity History
| Year | Total Pop | Foreign Born | Native Born |
|---|---|---|---|
| 2024 | 226,491 | 2.4% | 97.6% |
| 2023 | 227,063 | 2.4% | 97.6% |
| 2022 | 227,979 | 2.4% | 97.6% |
| 2021 | 229,044 | 2.2% | 97.8% |
| 2020 | 228,452 | 2.5% | 97.5% |
| 2019 | 229,961 | 2.3% | 97.7% |
| 2018 | 231,064 | 2.4% | 97.6% |
| 2017 | 231,857 | 2.6% | 97.4% |
| 2016 | 233,015 | 2.8% | 97.2% |
| 2015 | 234,550 | 2.9% | 97.1% |
| 2014 | 235,809 | 3.1% | 96.9% |
| 2013 | 237,033 | 3.2% | 96.8% |
| 2012 | 238,352 | 3.1% | 96.9% |
| 2011 | 240,131 | 3.2% | 96.8% |
| 2010 | 241,899 | 3.1% | 96.9% |
Nativity & Citizenship FAQs for Mahoning County, Ohio
Approximately 2.4% of residents in Mahoning County, Ohio were born outside the United States.
The vast majority of residents, roughly 99.0%, are U.S. citizens (including both native-born and naturalized citizens).