Montgomery County, Ohio Nativity & Citizenship Status (2024)
Place of birth and citizenship status analysis for Montgomery County, Ohio
Montgomery County, Ohio Nativity & Citizenship Indicators (2024)
Native Born
94.7%
Foreign Born
5.3%
Naturalized
2.7%
US Citizens
97.4%
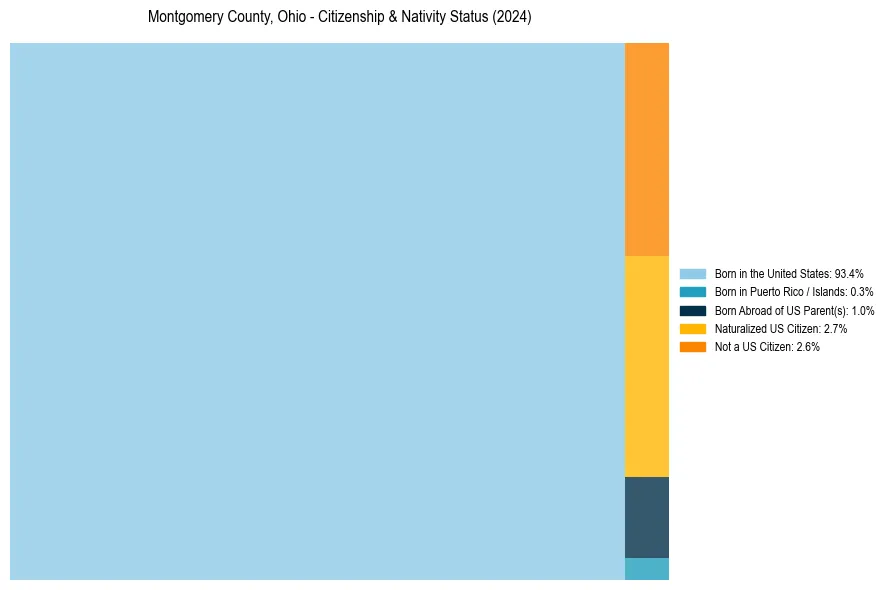
Montgomery County, Ohio Nativity & Citizenship Distribution
Montgomery County, Ohio Historical Nativity Trends (2010–2024)
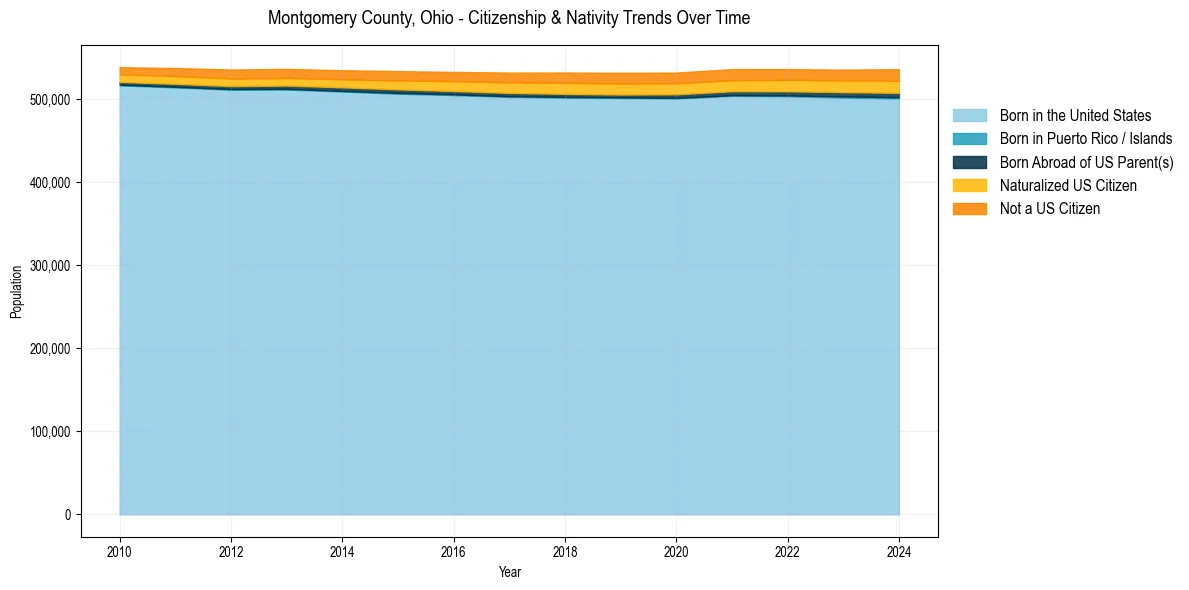
Montgomery County, Ohio Population & Nativity History
| Year | Total Pop | Foreign Born | Native Born |
|---|---|---|---|
| 2024 | 536,096 | 5.3% | 94.7% |
| 2023 | 535,528 | 5.1% | 94.9% |
| 2022 | 536,121 | 5.0% | 95.0% |
| 2021 | 536,136 | 5.0% | 95.0% |
| 2020 | 531,988 | 4.9% | 95.1% |
| 2019 | 531,670 | 4.9% | 95.1% |
| 2018 | 532,034 | 4.8% | 95.2% |
| 2017 | 531,987 | 4.6% | 95.4% |
| 2016 | 532,761 | 4.3% | 95.7% |
| 2015 | 533,763 | 4.1% | 95.9% |
| 2014 | 534,801 | 3.9% | 96.1% |
| 2013 | 536,433 | 3.7% | 96.3% |
| 2012 | 535,626 | 3.7% | 96.3% |
| 2011 | 537,409 | 3.5% | 96.5% |
| 2010 | 538,461 | 3.3% | 96.7% |
Nativity & Citizenship FAQs for Montgomery County, Ohio
Approximately 5.3% of residents in Montgomery County, Ohio were born outside the United States.
The vast majority of residents, roughly 97.4%, are U.S. citizens (including both native-born and naturalized citizens).