Stark County, Ohio Nativity & Citizenship Status (2024)
Place of birth and citizenship status analysis for Stark County, Ohio
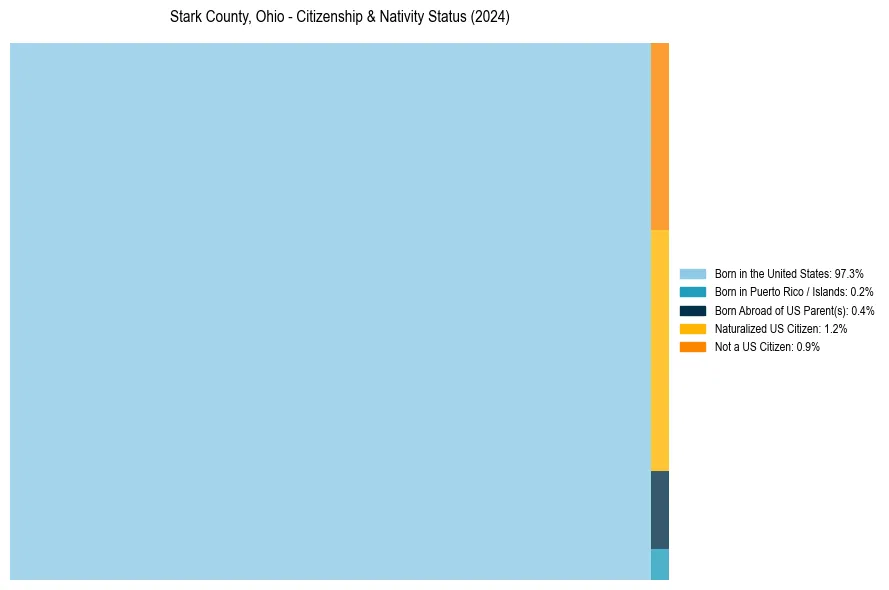
Stark County, Ohio Nativity & Citizenship Indicators (2024)
Native Born
97.8%
Foreign Born
2.2%
Naturalized
1.2%
US Citizens
99.1%
Stark County, Ohio Nativity & Citizenship Distribution
Stark County, Ohio Historical Nativity Trends (2010–2024)
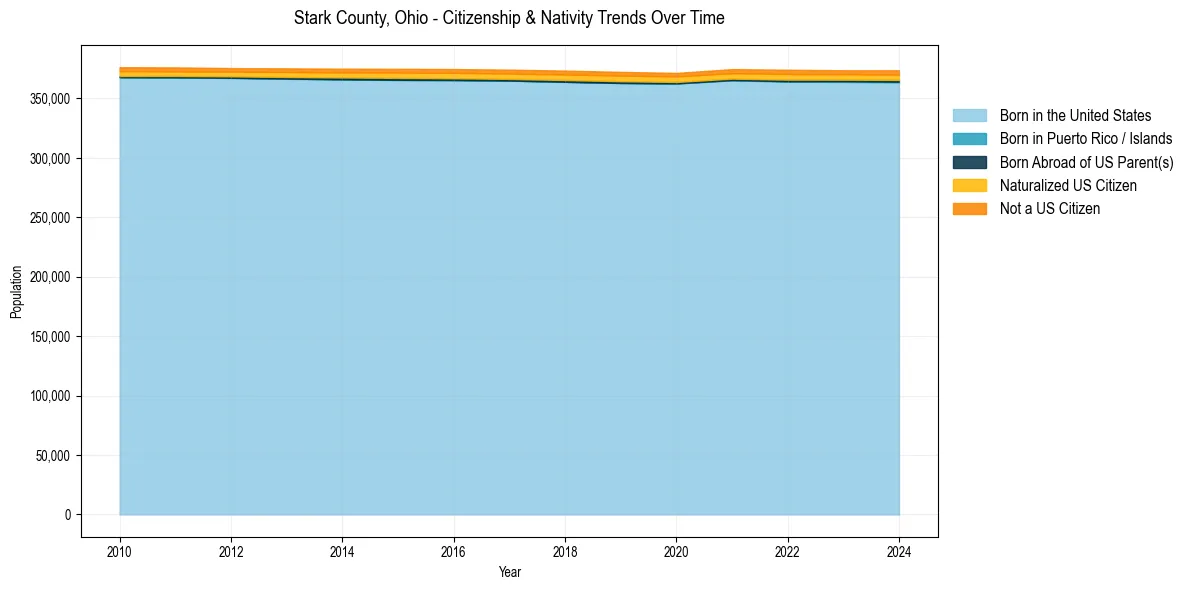
Stark County, Ohio Population & Nativity History
| Year | Total Pop | Foreign Born | Native Born |
|---|---|---|---|
| 2024 | 373,713 | 2.2% | 97.8% |
| 2023 | 373,764 | 2.1% | 97.9% |
| 2022 | 374,199 | 2.2% | 97.8% |
| 2021 | 374,712 | 2.1% | 97.9% |
| 2020 | 371,516 | 2.0% | 98.0% |
| 2019 | 372,404 | 2.1% | 97.9% |
| 2018 | 373,475 | 2.1% | 97.9% |
| 2017 | 374,273 | 2.1% | 97.9% |
| 2016 | 374,762 | 2.1% | 97.9% |
| 2015 | 374,979 | 2.0% | 98.0% |
| 2014 | 375,090 | 2.0% | 98.0% |
| 2013 | 375,348 | 1.9% | 98.1% |
| 2012 | 375,593 | 1.8% | 98.2% |
| 2011 | 376,142 | 1.9% | 98.1% |
| 2010 | 376,346 | 2.0% | 98.0% |
Nativity & Citizenship FAQs for Stark County, Ohio
Approximately 2.2% of residents in Stark County, Ohio were born outside the United States.
The vast majority of residents, roughly 99.1%, are U.S. citizens (including both native-born and naturalized citizens).