Summit County, Ohio Nativity & Citizenship Status (2024)
Place of birth and citizenship status analysis for Summit County, Ohio
Summit County, Ohio Nativity & Citizenship Indicators (2024)
Native Born
94.0%
Foreign Born
6.0%
Naturalized
3.4%
US Citizens
97.4%
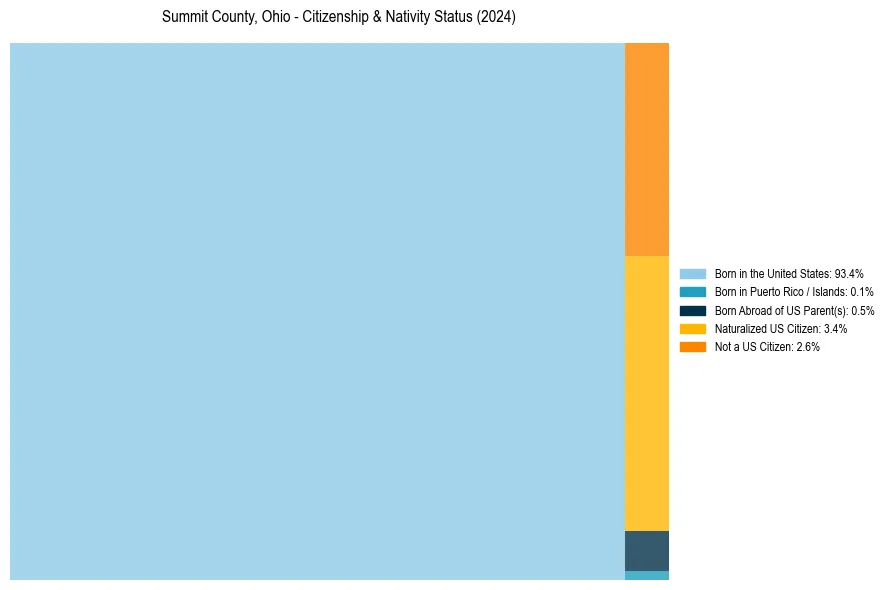
Summit County, Ohio Nativity & Citizenship Distribution
Summit County, Ohio Historical Nativity Trends (2010–2024)
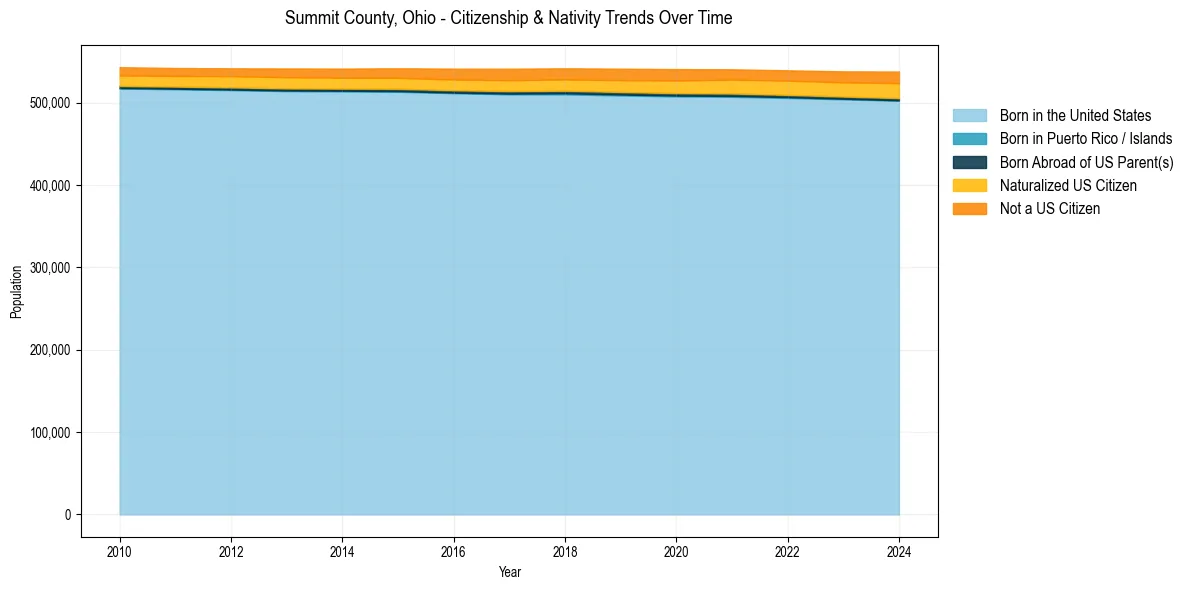
Summit County, Ohio Population & Nativity History
| Year | Total Pop | Foreign Born | Native Born |
|---|---|---|---|
| 2024 | 537,864 | 6.0% | 94.0% |
| 2023 | 538,087 | 5.7% | 94.3% |
| 2022 | 539,361 | 5.5% | 94.5% |
| 2021 | 540,567 | 5.4% | 94.6% |
| 2020 | 540,810 | 5.4% | 94.6% |
| 2019 | 541,334 | 5.2% | 94.8% |
| 2018 | 541,810 | 5.0% | 95.0% |
| 2017 | 541,318 | 5.0% | 95.0% |
| 2016 | 541,372 | 4.8% | 95.2% |
| 2015 | 541,847 | 4.6% | 95.4% |
| 2014 | 541,464 | 4.5% | 95.5% |
| 2013 | 541,592 | 4.5% | 95.5% |
| 2012 | 541,788 | 4.3% | 95.7% |
| 2011 | 542,169 | 4.2% | 95.8% |
| 2010 | 543,150 | 4.2% | 95.8% |
Nativity & Citizenship FAQs for Summit County, Ohio
Approximately 6.0% of residents in Summit County, Ohio were born outside the United States.
The vast majority of residents, roughly 97.4%, are U.S. citizens (including both native-born and naturalized citizens).