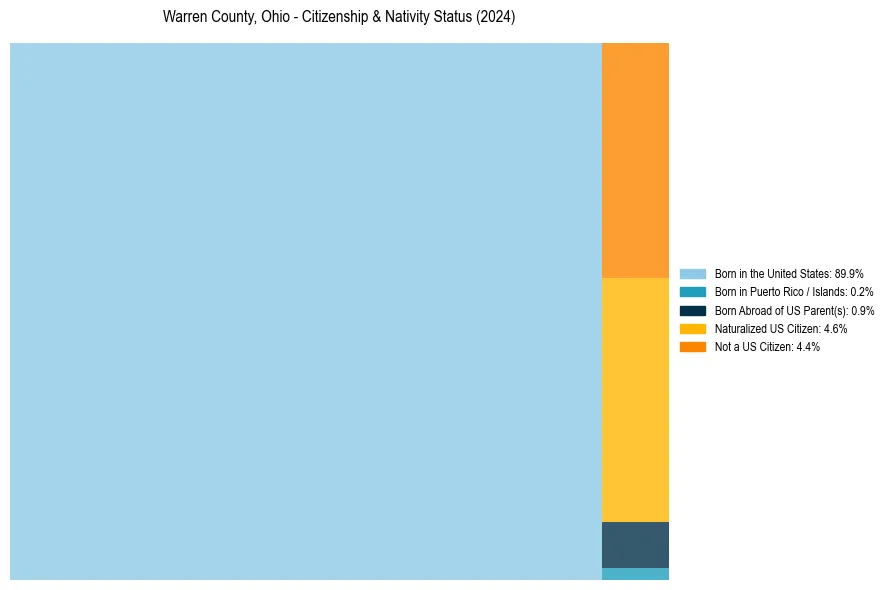
Warren County, Ohio Nativity & Citizenship Status (2024)
Place of birth and citizenship status analysis for Warren County, Ohio
Warren County, Ohio Nativity & Citizenship Indicators (2024)
Native Born
90.9%
Foreign Born
9.1%
Naturalized
4.6%
US Citizens
95.6%
Warren County, Ohio Nativity & Citizenship Distribution
Warren County, Ohio Historical Nativity Trends (2010–2024)
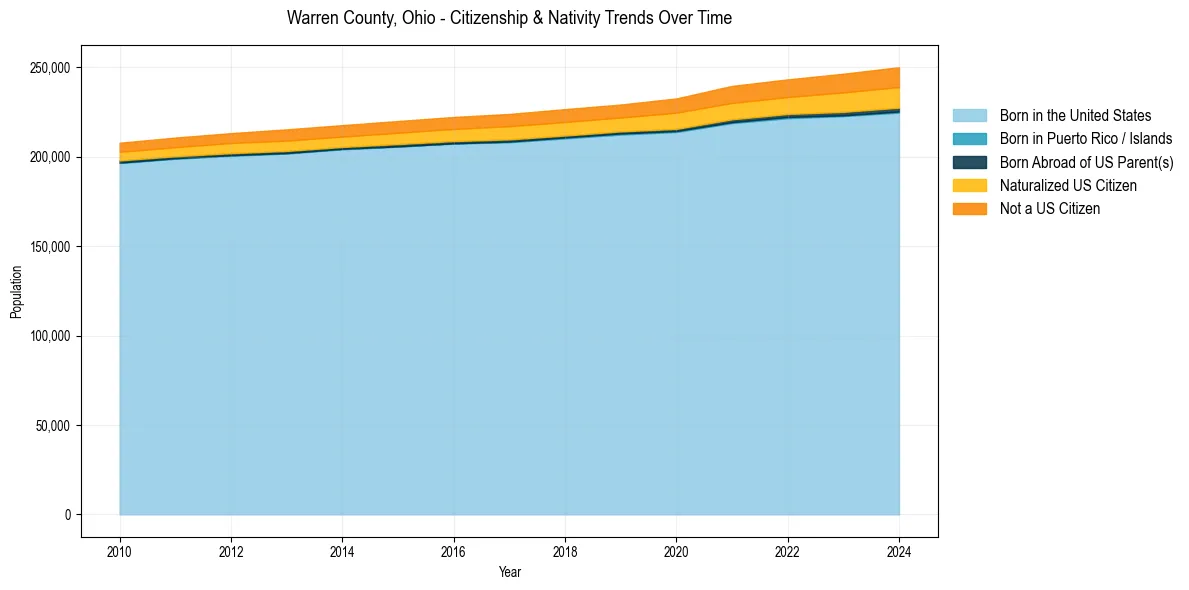
Warren County, Ohio Population & Nativity History
| Year | Total Pop | Foreign Born | Native Born |
|---|---|---|---|
| 2024 | 250,008 | 9.1% | 90.9% |
| 2023 | 246,364 | 8.7% | 91.3% |
| 2022 | 243,189 | 8.0% | 92.0% |
| 2021 | 239,556 | 7.8% | 92.2% |
| 2020 | 232,540 | 7.3% | 92.7% |
| 2019 | 229,132 | 6.6% | 93.4% |
| 2018 | 226,564 | 6.5% | 93.5% |
| 2017 | 223,868 | 6.3% | 93.7% |
| 2016 | 222,184 | 6.1% | 93.9% |
| 2015 | 219,916 | 5.9% | 94.1% |
| 2014 | 217,623 | 5.6% | 94.4% |
| 2013 | 215,274 | 5.6% | 94.4% |
| 2012 | 213,146 | 5.3% | 94.7% |
| 2011 | 210,662 | 5.0% | 95.0% |
| 2010 | 207,790 | 4.8% | 95.2% |
Nativity & Citizenship FAQs for Warren County, Ohio
Approximately 9.1% of residents in Warren County, Ohio were born outside the United States.
The vast majority of residents, roughly 95.6%, are U.S. citizens (including both native-born and naturalized citizens).