Wyandot County, Ohio Nativity & Citizenship Status (2024)
Place of birth and citizenship status analysis for Wyandot County, Ohio
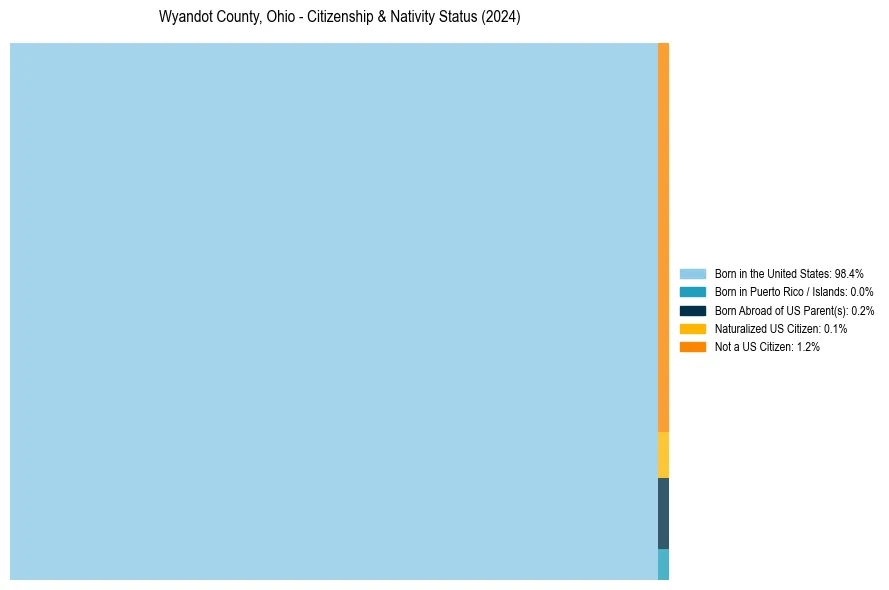
Wyandot County, Ohio Nativity & Citizenship Indicators (2024)
Native Born
98.6%
Foreign Born
1.4%
Naturalized
0.1%
US Citizens
98.8%
Wyandot County, Ohio Nativity & Citizenship Distribution
Wyandot County, Ohio Historical Nativity Trends (2010–2024)
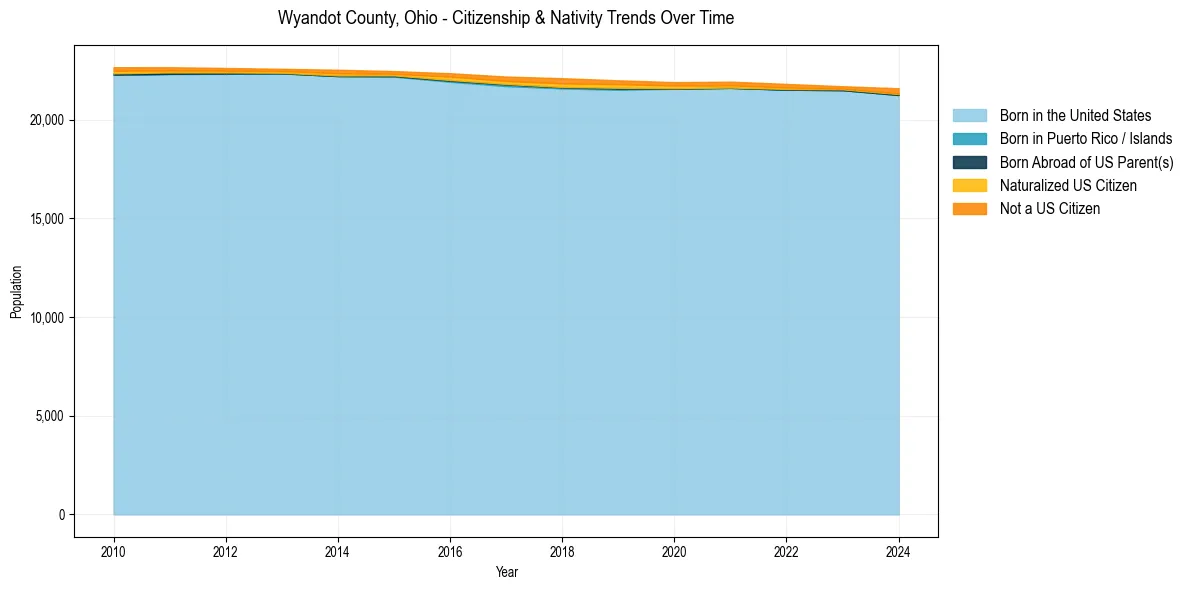
Wyandot County, Ohio Population & Nativity History
| Year | Total Pop | Foreign Born | Native Born |
|---|---|---|---|
| 2024 | 21,598 | 1.4% | 98.6% |
| 2023 | 21,699 | 0.7% | 99.3% |
| 2022 | 21,818 | 1.2% | 98.8% |
| 2021 | 21,933 | 1.4% | 98.6% |
| 2020 | 21,907 | 1.4% | 98.6% |
| 2019 | 22,000 | 1.7% | 98.3% |
| 2018 | 22,107 | 2.0% | 98.0% |
| 2017 | 22,190 | 1.7% | 98.3% |
| 2016 | 22,359 | 1.5% | 98.5% |
| 2015 | 22,467 | 1.0% | 99.0% |
| 2014 | 22,535 | 1.3% | 98.7% |
| 2013 | 22,582 | 0.9% | 99.1% |
| 2012 | 22,626 | 1.0% | 99.0% |
| 2011 | 22,661 | 1.2% | 98.8% |
| 2010 | 22,665 | 1.4% | 98.6% |
Nativity & Citizenship FAQs for Wyandot County, Ohio
Approximately 1.4% of residents in Wyandot County, Ohio were born outside the United States.
The vast majority of residents, roughly 98.8%, are U.S. citizens (including both native-born and naturalized citizens).