Oklahoma Age & Gender Distribution (2024)
Population distribution by age and gender for Oklahoma
Oklahoma Age & Gender Statistics (2024)
Total Population
4,028,634
Median Age
37.0
Male Median
36.0
Female Median
38.1
Oklahoma Population Growth
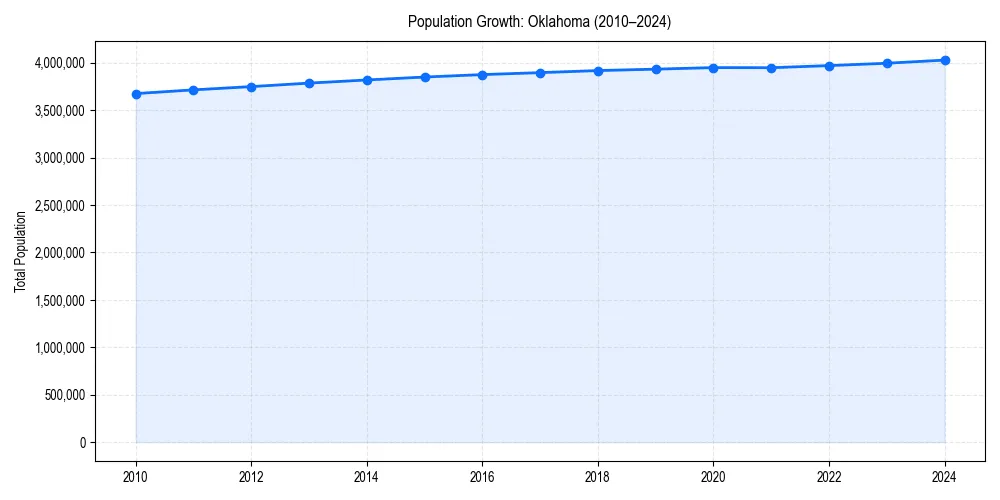
Oklahoma Demographic Trend
Since 2010, the population of has changed by +9.6%%.
+9.6%% Growth
Oklahoma Age & Gender Pyramid
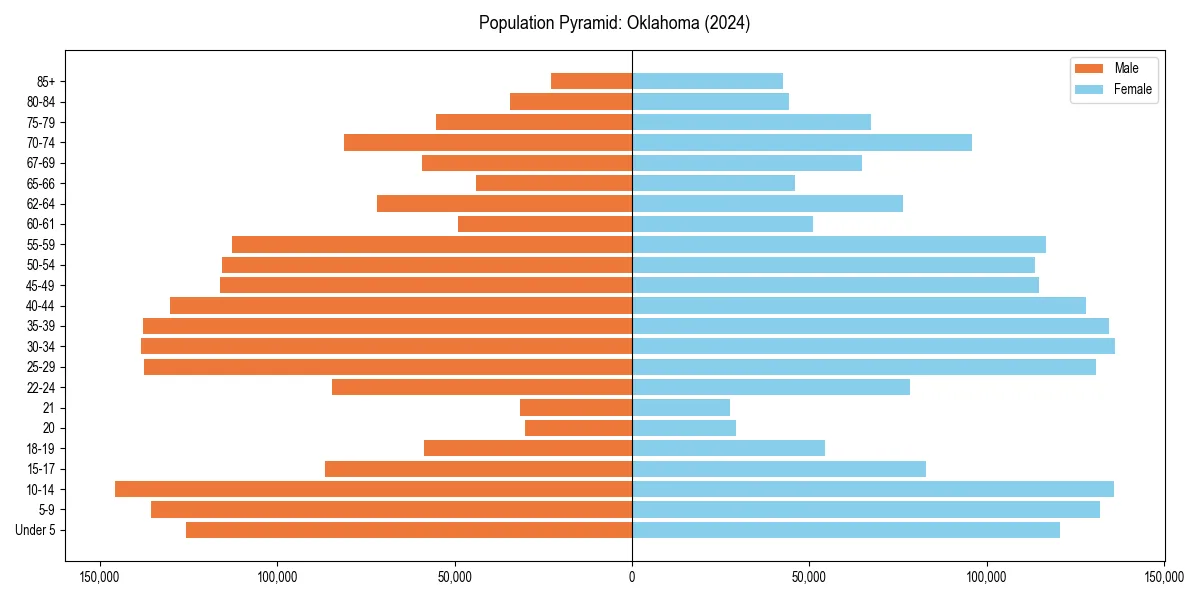
Figure 2: Population distribution by age and gender for 2024.
Oklahoma Historical Population Data
| Year | Median Age | Population |
|---|---|---|
| 2024 | 37.0 | 4,028,634 |
| 2023 | 36.9 | 3,995,260 |
| 2022 | 36.9 | 3,970,497 |
| 2021 | 36.8 | 3,948,136 |
| 2020 | 36.7 | 3,949,342 |
| 2019 | 36.6 | 3,932,870 |
| 2018 | 36.4 | 3,918,137 |
| 2017 | 36.3 | 3,896,251 |
| 2016 | 36.2 | 3,875,589 |
| 2015 | 36.2 | 3,849,733 |
| 2014 | 36.2 | 3,818,851 |
| 2013 | 36.2 | 3,785,742 |
| 2012 | 36.3 | 3,749,005 |
| 2011 | 36.3 | 3,714,520 |
| 2010 | 36.3 | 3,675,339 |
Oklahoma Age Group Breakdown (2024)
| Age Cohort | Percentage |
|---|---|
| Under 5 | 6.1% |
| 5–17 | 17.8% |
| 18–24 | 9.8% |
| 25–34 | 13.5% |
| 35–54 | 24.6% |
| 55–64 | 11.9% |
| 65+ | 16.3% |
Dependency Ratios for Oklahoma
- Total Dependency Ratio:
- 67.4
- Youth Dependency:
- 40.1
- Old-Age Dependency:
- 27.3
The dependency ratio measures dependents (ages 0-17 and 65+) per 100 working-age individuals (ages 18-64).
Age & Gender FAQs for Oklahoma
The median age in Oklahoma is 37.0 years.
According to latest Census data, the total population of Oklahoma is 4,028,634.
In Oklahoma, seniors (ages 65+) make up 16.3% of the population, while children under 18 represent 17.8%.
Based on historical data since 2010, the population in Oklahoma has remained stable.