Oregon Age & Gender Distribution (2024)
Population distribution by age and gender for Oregon
Oregon Age & Gender Statistics (2024)
Total Population
4,254,293
Median Age
40.4
Male Median
39.5
Female Median
41.3
Oregon Population Growth
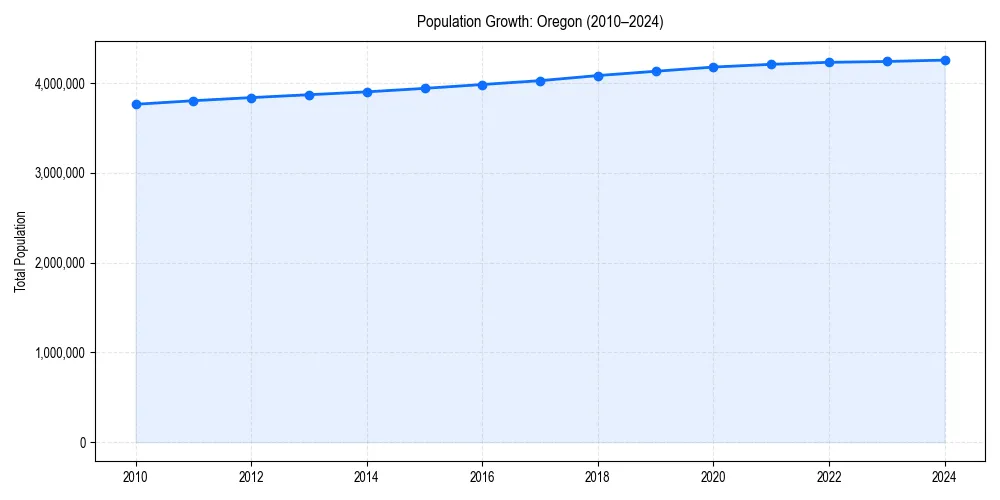
Oregon Demographic Trend
Since 2010, the population of has changed by +13.1%%.
+13.1%% Growth
Oregon Age & Gender Pyramid
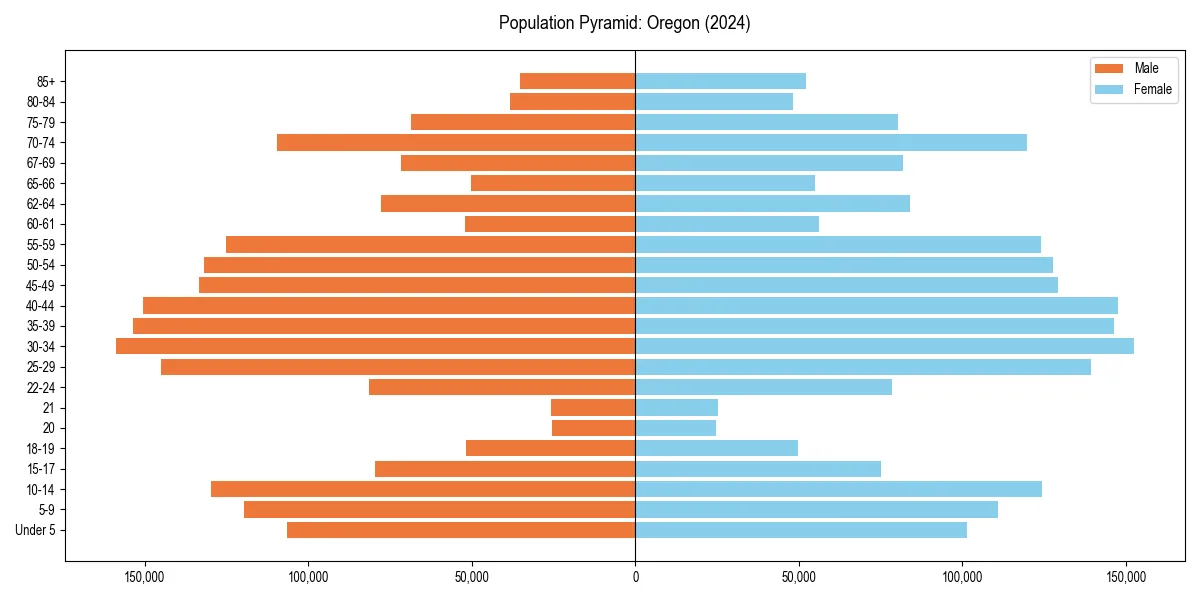
Figure 2: Population distribution by age and gender for 2024.
Oregon Historical Population Data
| Year | Median Age | Population |
|---|---|---|
| 2024 | 40.4 | 4,254,293 |
| 2023 | 40.1 | 4,238,714 |
| 2022 | 39.9 | 4,229,374 |
| 2021 | 39.6 | 4,207,177 |
| 2020 | 39.5 | 4,176,346 |
| 2019 | 39.3 | 4,129,803 |
| 2018 | 39.2 | 4,081,943 |
| 2017 | 39.2 | 4,025,127 |
| 2016 | 39.1 | 3,982,267 |
| 2015 | 39.1 | 3,939,233 |
| 2014 | 38.9 | 3,900,343 |
| 2013 | 38.7 | 3,868,721 |
| 2012 | 38.4 | 3,836,628 |
| 2011 | 38.2 | 3,801,991 |
| 2010 | 38.1 | 3,761,925 |
Oregon Age Group Breakdown (2024)
| Age Cohort | Percentage |
|---|---|
| Under 5 | 4.9% |
| 5–17 | 15.0% |
| 18–24 | 8.5% |
| 25–34 | 14.0% |
| 35–54 | 26.3% |
| 55–64 | 12.2% |
| 65+ | 19.1% |
Dependency Ratios for Oregon
- Total Dependency Ratio:
- 63.9
- Youth Dependency:
- 32.6
- Old-Age Dependency:
- 31.2
The dependency ratio measures dependents (ages 0-17 and 65+) per 100 working-age individuals (ages 18-64).
Age & Gender FAQs for Oregon
The median age in Oregon is 40.4 years.
According to latest Census data, the total population of Oregon is 4,254,293.
In Oregon, seniors (ages 65+) make up 19.1% of the population, while children under 18 represent 15.0%.
Based on historical data since 2010, the population in Oregon is aging.