Clackamas County, Oregon Nativity & Citizenship Status (2024)
Place of birth and citizenship status analysis for Clackamas County, Oregon
Clackamas County, Oregon Nativity & Citizenship Indicators (2024)
Native Born
91.2%
Foreign Born
8.8%
Naturalized
5.3%
US Citizens
96.5%
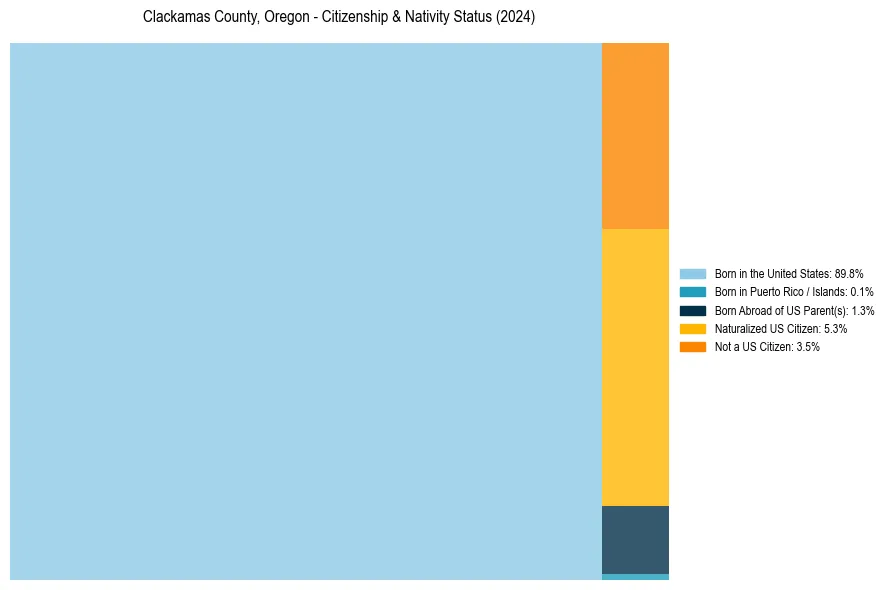
Clackamas County, Oregon Nativity & Citizenship Distribution
Clackamas County, Oregon Historical Nativity Trends (2010–2024)
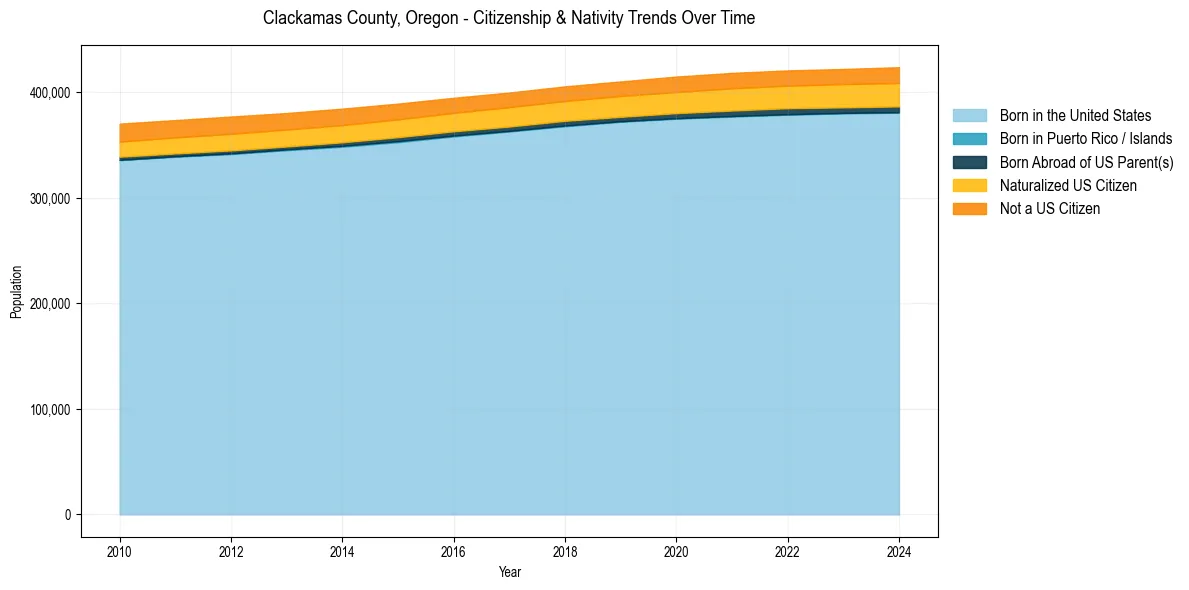
Clackamas County, Oregon Population & Nativity History
| Year | Total Pop | Foreign Born | Native Born |
|---|---|---|---|
| 2024 | 423,975 | 8.8% | 91.2% |
| 2023 | 422,308 | 8.6% | 91.4% |
| 2022 | 420,925 | 8.5% | 91.5% |
| 2021 | 418,577 | 8.5% | 91.5% |
| 2020 | 415,084 | 8.4% | 91.6% |
| 2019 | 410,463 | 8.2% | 91.8% |
| 2018 | 405,788 | 8.0% | 92.0% |
| 2017 | 399,962 | 8.1% | 91.9% |
| 2016 | 394,967 | 8.0% | 92.0% |
| 2015 | 389,438 | 8.2% | 91.8% |
| 2014 | 384,697 | 8.3% | 91.7% |
| 2013 | 380,532 | 8.3% | 91.7% |
| 2012 | 377,206 | 8.5% | 91.5% |
| 2011 | 373,832 | 8.5% | 91.5% |
| 2010 | 370,479 | 8.5% | 91.5% |
Nativity & Citizenship FAQs for Clackamas County, Oregon
Approximately 8.8% of residents in Clackamas County, Oregon were born outside the United States.
The vast majority of residents, roughly 96.5%, are U.S. citizens (including both native-born and naturalized citizens).