Deschutes County, Oregon Nativity & Citizenship Status (2024)
Place of birth and citizenship status analysis for Deschutes County, Oregon
Deschutes County, Oregon Nativity & Citizenship Indicators (2024)
Native Born
95.1%
Foreign Born
4.9%
Naturalized
2.1%
US Citizens
97.2%
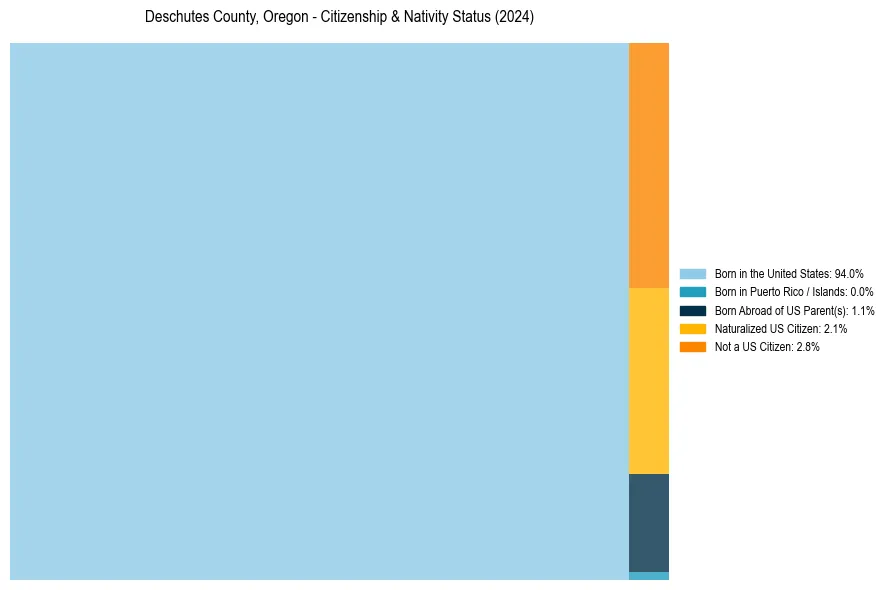
Deschutes County, Oregon Nativity & Citizenship Distribution
Deschutes County, Oregon Historical Nativity Trends (2010–2024)
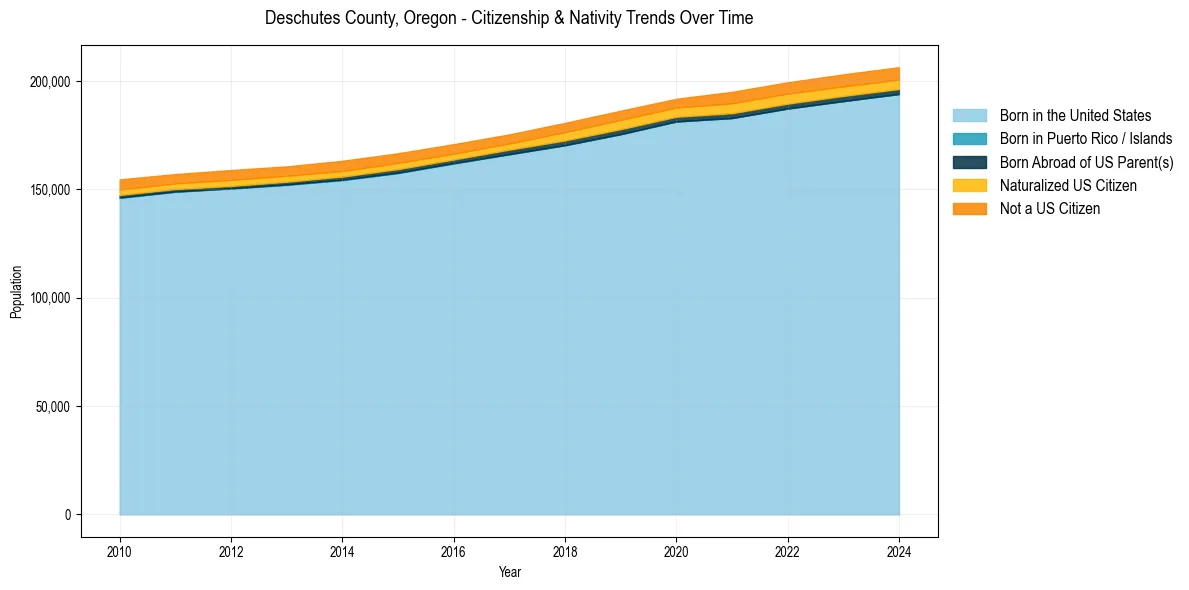
Deschutes County, Oregon Population & Nativity History
| Year | Total Pop | Foreign Born | Native Born |
|---|---|---|---|
| 2024 | 206,334 | 4.9% | 95.1% |
| 2023 | 203,026 | 4.9% | 95.1% |
| 2022 | 199,352 | 4.9% | 95.1% |
| 2021 | 194,964 | 5.1% | 94.9% |
| 2020 | 191,749 | 4.3% | 95.7% |
| 2019 | 186,251 | 4.6% | 95.4% |
| 2018 | 180,640 | 4.5% | 95.5% |
| 2017 | 175,321 | 4.0% | 96.0% |
| 2016 | 170,813 | 4.1% | 95.9% |
| 2015 | 166,622 | 4.4% | 95.6% |
| 2014 | 163,141 | 4.5% | 95.5% |
| 2013 | 160,565 | 4.4% | 95.6% |
| 2012 | 158,884 | 4.6% | 95.4% |
| 2011 | 157,014 | 4.4% | 95.6% |
| 2010 | 154,568 | 4.7% | 95.3% |
Nativity & Citizenship FAQs for Deschutes County, Oregon
Approximately 4.9% of residents in Deschutes County, Oregon were born outside the United States.
The vast majority of residents, roughly 97.2%, are U.S. citizens (including both native-born and naturalized citizens).