Hood River County, Oregon Nativity & Citizenship Status (2024)
Place of birth and citizenship status analysis for Hood River County, Oregon
Hood River County, Oregon Nativity & Citizenship Indicators (2024)
Native Born
86.5%
Foreign Born
13.5%
Naturalized
4.6%
US Citizens
91.2%
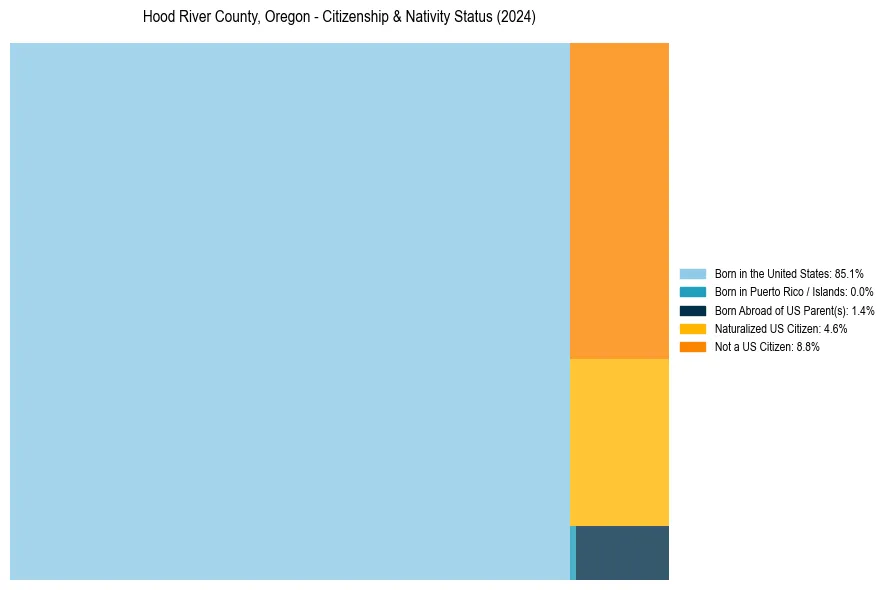
Hood River County, Oregon Nativity & Citizenship Distribution
Hood River County, Oregon Historical Nativity Trends (2010–2024)
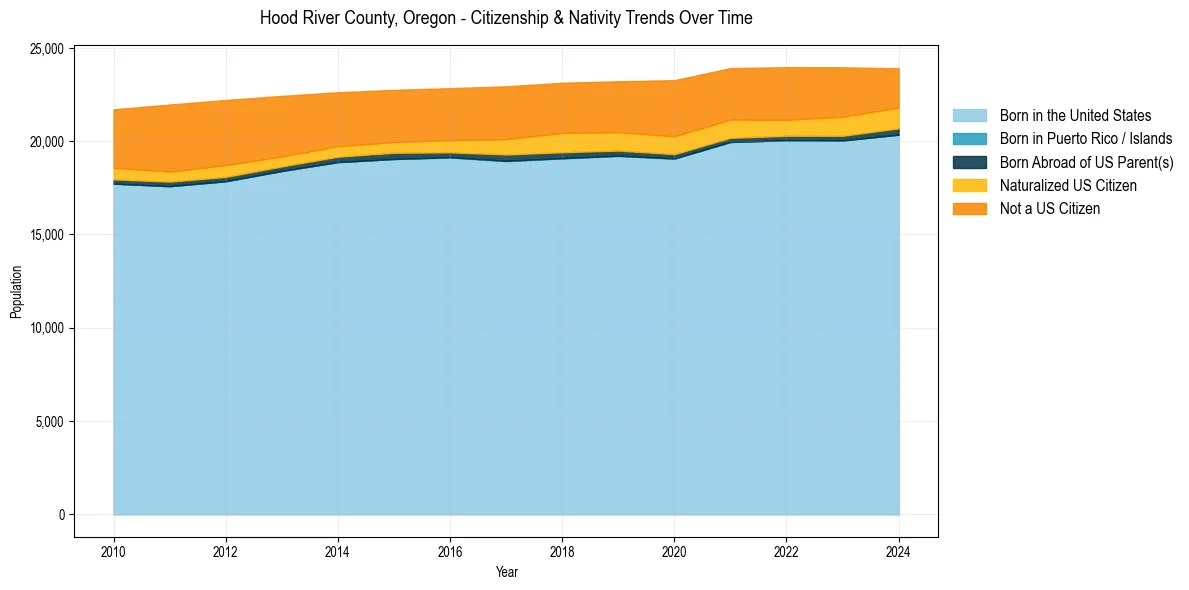
Hood River County, Oregon Population & Nativity History
| Year | Total Pop | Foreign Born | Native Born |
|---|---|---|---|
| 2024 | 23,905 | 13.5% | 86.5% |
| 2023 | 23,958 | 15.3% | 84.7% |
| 2022 | 23,965 | 15.4% | 84.6% |
| 2021 | 23,915 | 15.6% | 84.4% |
| 2020 | 23,270 | 17.0% | 83.0% |
| 2019 | 23,209 | 16.0% | 84.0% |
| 2018 | 23,131 | 16.1% | 83.9% |
| 2017 | 22,938 | 15.9% | 84.1% |
| 2016 | 22,842 | 15.1% | 84.9% |
| 2015 | 22,749 | 14.8% | 85.2% |
| 2014 | 22,620 | 15.3% | 84.7% |
| 2013 | 22,427 | 16.9% | 83.1% |
| 2012 | 22,207 | 18.6% | 81.4% |
| 2011 | 21,962 | 18.8% | 81.2% |
| 2010 | 21,706 | 17.3% | 82.7% |
Nativity & Citizenship FAQs for Hood River County, Oregon
Approximately 13.5% of residents in Hood River County, Oregon were born outside the United States.
The vast majority of residents, roughly 91.2%, are U.S. citizens (including both native-born and naturalized citizens).