Jackson County, Oregon Nativity & Citizenship Status (2024)
Place of birth and citizenship status analysis for Jackson County, Oregon
Jackson County, Oregon Nativity & Citizenship Indicators (2024)
Native Born
94.7%
Foreign Born
5.3%
Naturalized
2.6%
US Citizens
97.3%
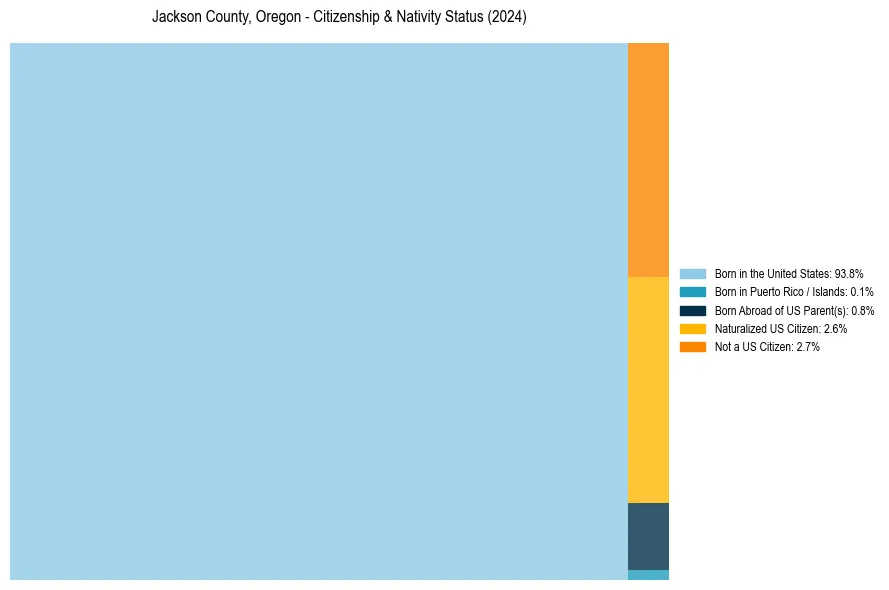
Jackson County, Oregon Nativity & Citizenship Distribution
Jackson County, Oregon Historical Nativity Trends (2010–2024)
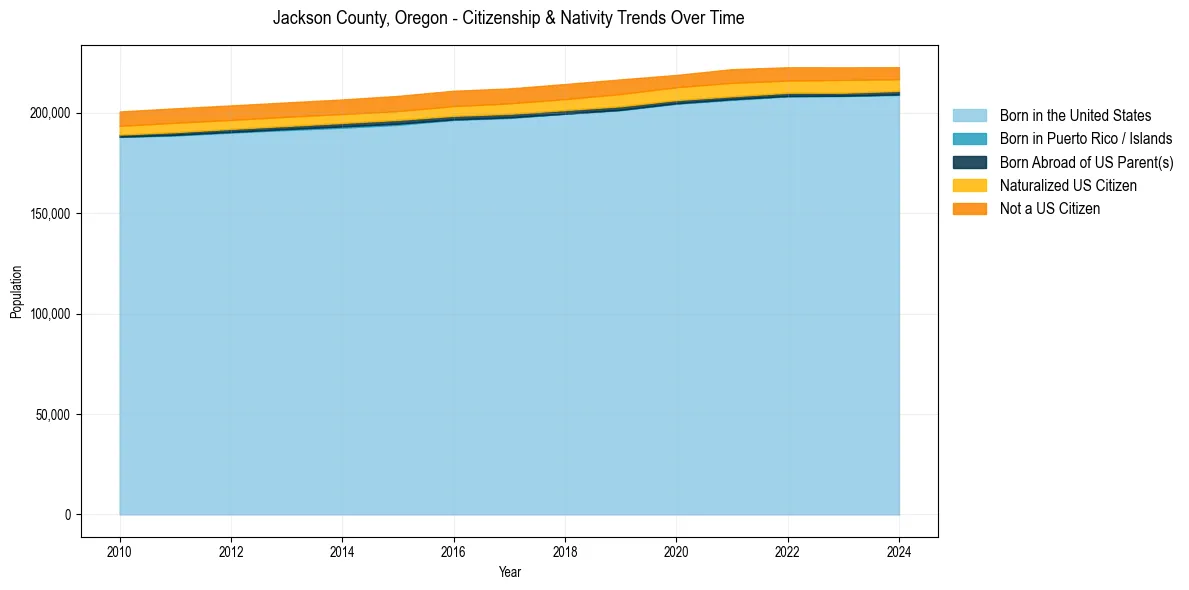
Jackson County, Oregon Population & Nativity History
| Year | Total Pop | Foreign Born | Native Born |
|---|---|---|---|
| 2024 | 222,645 | 5.3% | 94.7% |
| 2023 | 222,563 | 5.7% | 94.3% |
| 2022 | 222,604 | 5.7% | 94.3% |
| 2021 | 221,662 | 6.1% | 93.9% |
| 2020 | 218,781 | 5.7% | 94.3% |
| 2019 | 216,574 | 6.2% | 93.8% |
| 2018 | 214,267 | 6.1% | 93.9% |
| 2017 | 212,070 | 6.0% | 94.0% |
| 2016 | 210,916 | 5.9% | 94.1% |
| 2015 | 208,363 | 5.7% | 94.3% |
| 2014 | 206,583 | 5.7% | 94.3% |
| 2013 | 205,117 | 5.7% | 94.3% |
| 2012 | 203,613 | 5.7% | 94.3% |
| 2011 | 202,178 | 5.9% | 94.1% |
| 2010 | 200,587 | 5.7% | 94.3% |
Nativity & Citizenship FAQs for Jackson County, Oregon
Approximately 5.3% of residents in Jackson County, Oregon were born outside the United States.
The vast majority of residents, roughly 97.3%, are U.S. citizens (including both native-born and naturalized citizens).