Linn County, Oregon Nativity & Citizenship Status (2024)
Place of birth and citizenship status analysis for Linn County, Oregon
Linn County, Oregon Nativity & Citizenship Indicators (2024)
Native Born
95.7%
Foreign Born
4.3%
Naturalized
1.8%
US Citizens
97.5%
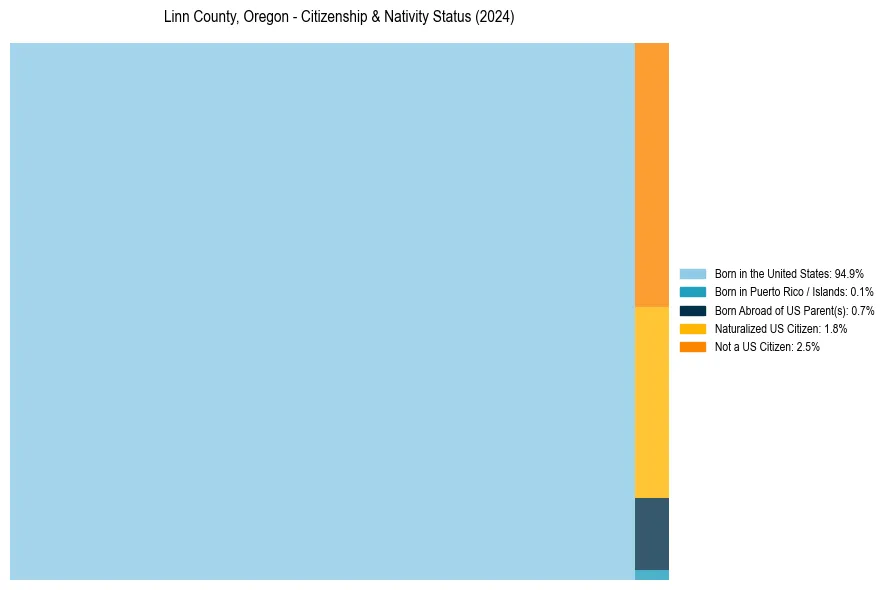
Linn County, Oregon Nativity & Citizenship Distribution
Linn County, Oregon Historical Nativity Trends (2010–2024)
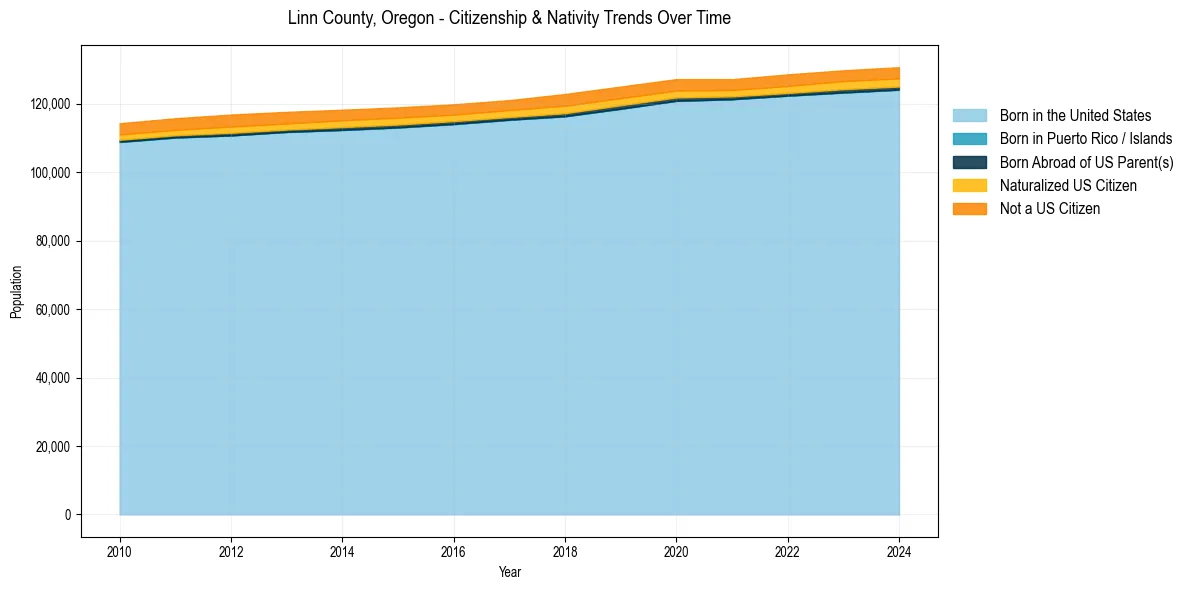
Linn County, Oregon Population & Nativity History
| Year | Total Pop | Foreign Born | Native Born |
|---|---|---|---|
| 2024 | 130,706 | 4.3% | 95.7% |
| 2023 | 129,794 | 4.3% | 95.7% |
| 2022 | 128,598 | 4.2% | 95.8% |
| 2021 | 127,200 | 4.0% | 96.0% |
| 2020 | 127,216 | 4.2% | 95.8% |
| 2019 | 125,048 | 4.4% | 95.6% |
| 2018 | 122,870 | 4.6% | 95.4% |
| 2017 | 121,074 | 4.1% | 95.9% |
| 2016 | 119,862 | 4.1% | 95.9% |
| 2015 | 118,971 | 4.2% | 95.8% |
| 2014 | 118,270 | 4.3% | 95.7% |
| 2013 | 117,648 | 4.4% | 95.6% |
| 2012 | 116,871 | 4.6% | 95.4% |
| 2011 | 115,776 | 4.3% | 95.7% |
| 2010 | 114,315 | 4.2% | 95.8% |
Nativity & Citizenship FAQs for Linn County, Oregon
Approximately 4.3% of residents in Linn County, Oregon were born outside the United States.
The vast majority of residents, roughly 97.5%, are U.S. citizens (including both native-born and naturalized citizens).