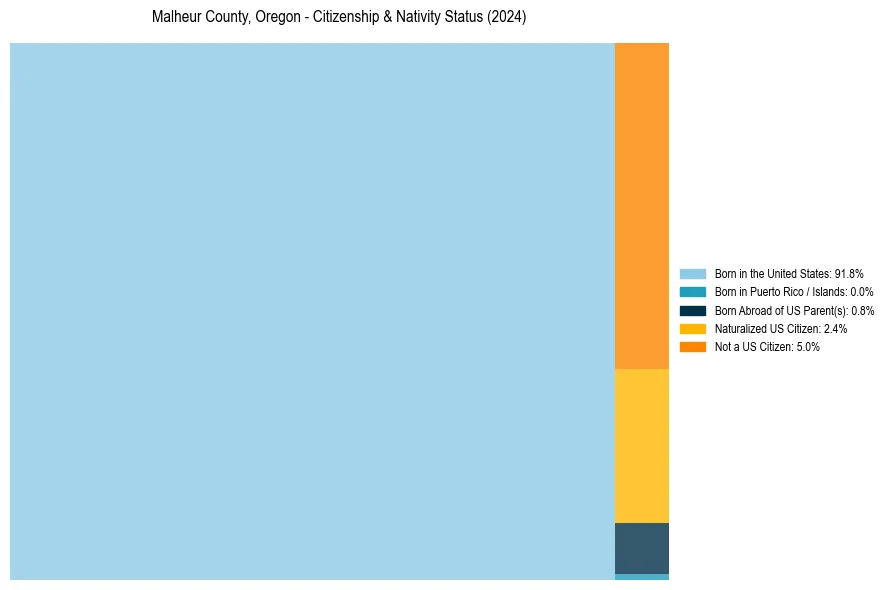
Malheur County, Oregon Nativity & Citizenship Status (2024)
Place of birth and citizenship status analysis for Malheur County, Oregon
Malheur County, Oregon Nativity & Citizenship Indicators (2024)
Native Born
92.6%
Foreign Born
7.4%
Naturalized
2.4%
US Citizens
95.0%
Malheur County, Oregon Nativity & Citizenship Distribution
Malheur County, Oregon Historical Nativity Trends (2010–2024)
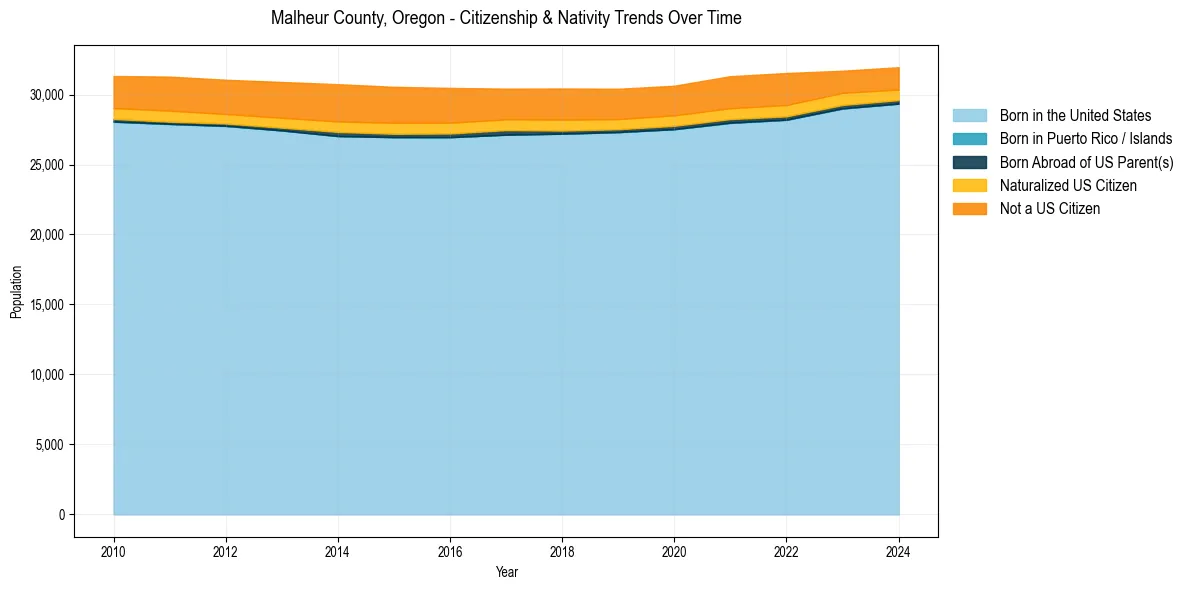
Malheur County, Oregon Population & Nativity History
| Year | Total Pop | Foreign Born | Native Born |
|---|---|---|---|
| 2024 | 31,954 | 7.4% | 92.6% |
| 2023 | 31,701 | 7.7% | 92.3% |
| 2022 | 31,538 | 9.8% | 90.2% |
| 2021 | 31,313 | 9.8% | 90.2% |
| 2020 | 30,632 | 9.4% | 90.6% |
| 2019 | 30,412 | 9.5% | 90.5% |
| 2018 | 30,431 | 9.9% | 90.1% |
| 2017 | 30,421 | 9.7% | 90.3% |
| 2016 | 30,474 | 10.7% | 89.3% |
| 2015 | 30,551 | 11.0% | 89.0% |
| 2014 | 30,740 | 11.1% | 88.9% |
| 2013 | 30,898 | 10.6% | 89.4% |
| 2012 | 31,057 | 10.1% | 89.9% |
| 2011 | 31,280 | 10.3% | 89.7% |
| 2010 | 31,326 | 9.8% | 90.2% |
Nativity & Citizenship FAQs for Malheur County, Oregon
Approximately 7.4% of residents in Malheur County, Oregon were born outside the United States.
The vast majority of residents, roughly 95.0%, are U.S. citizens (including both native-born and naturalized citizens).